
Stocks are risky but they generate high returns. Bonds are safer but they offer proportionally less returns. Investors may think that combining these asset classes in a portfolio linearly scales risk versus return. For the most part this is true; but due to a lack of correlation between these assets, combining them in a portfolio can actually increase returns without increasing risk.
Let’s take a look at the data going back to 1871. US stocks have generated an average annualized return of almost 9%. A mere $10 investment back in 1871 would be worth almost $2 million today with reinvested dividends. That’s a huge return; but the investor would have had to stomach a decent amount of risk, defined by standard deviation. In this same time period the standard deviation of yearly returns was 18% meaning that roughly 70% of yearly returns fall within a ±18% range of the average. That’s a lot of variation!
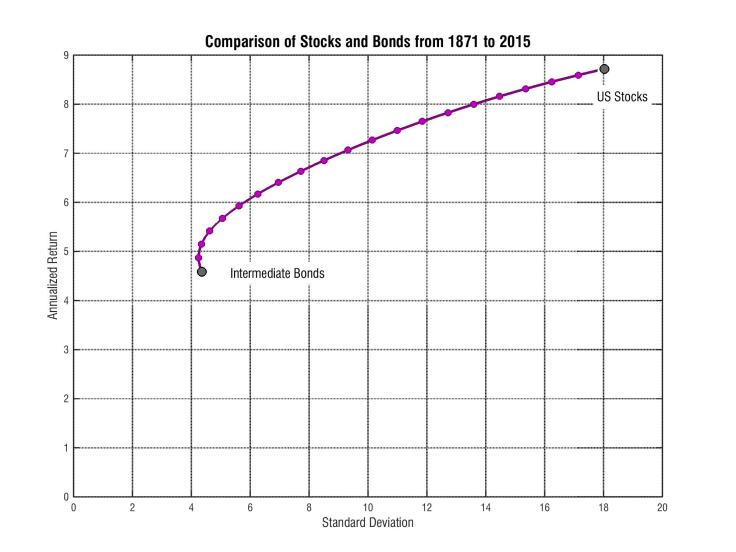
Meanwhile, intermediate bonds going back to 1871 yielded an annualized return of nearly 5% with a standard deviation of just over 4%. That $10 investment in 1871 would be worth almost $7,000 by the end of 2015.
But what happens when we combine varying amounts of stocks and bonds in a portfolio? The following plot shows risk (standard deviation of yearly returns) versus average yearly return for 40 different portfolios (blue dots). Adding a small proportion of stocks to a portfolio of bonds increases returns as one would be expected; but it does so while decreasing risk!
Now what happens when we add a third asset? Adding treasury bills, arguably the safest asset class available to an investor, again creates an opportunity to increase returns while decreasing risk.

The following table summarizes the performance of stocks and bonds going back to 1871 and includes two portfolios that highlight how combining stocks with bonds can increase returns without increasing risk.
| Stocks | Bonds | T-Bills | Portfolio 1 | Portfolio 2 | |
|---|---|---|---|---|---|
| Stock % | 100 | 0 | 0 | 9 | 20 |
| Bond % | 0 | 100 | 0 | 91 | 45 |
| T-Bills % | 0 | 0 | 100 | 0 | 35 |
| Standard Deviation (%) | 18.0 | 4.4 | 2.6 | 4.3 | 4.4 |
| Annualized Return (%) | 8.7 | 4.6 | 4.2 | 5.1 | 5.5 |
| Value of $10 Investment | $1,838,400 | $6,700 | $3,800 | $13,400 | $24,900 |
| Real Value After Inflation | $97,000 | $355 | $200 | $705 | $1315 |
| Largest Loss (%) | -43 | -5 | 0 | -4 | -8 |
| Frequency of + Years (%) | 74 | 92 | 100 | 94 | 93 |
In this example “Portfolio 1” had the same level of risk as a portfolio of just bonds; but the increase in returns by adding a small amount of stocks (9%) resulted in twice as much money in your pocket. Now if we are able to add treasury bills to the portfolio we’re able to increase the stock allocation to 20% while still maintaining the same level of risk. The increase in returns results in an investment growing to almost 4 times greater one in only bonds.
This brief analysis only looked at three asset classes, two of which were “safe” bonds. What happens when we add more risky stock asset classes? How much can we increase returns without taking on more risk?

Disclosures
The author(s) of this site have no formal financial investing training or certifications. The content on this site is provided as general information only and should not be taken as investment advice. All site content shall not be construed as a recommendation to buy or sell any security or financial instrument, or to participate in any particular trading or investment strategy. The ideas expressed on this site are solely the opinions of the author(s) and do not necessarily represent the opinions of sponsors or firms affiliated with the author(s). The author may or may not have a position in any company or advertiser referenced above. Any action that you take as a result of information, analysis, or advertisement on this site is ultimately your responsibility. Consult your investment adviser before making any investment decisions. This site/blog contains the current opinions of the author; the author’s opinions are subject to change without notice. This site is for informational purposes only and should not be considered as investment advice or a recommendation of any particular security, strategy or investment product. The charts and comments are only the author’s view of market activity and aren’t recommendations to buy or sell any security. Market sectors and related ETFs are selected based on his opinion as to their importance in providing the viewer a comprehensive summary of market conditions for the featured period. Chart annotations aren’t predictive of any future market action rather they only demonstrate the author’s opinion as to a range of possibilities going forward. All material presented herein is believed to be reliable but we cannot attest to its accuracy. The information contained herein (including historical prices or values) has been obtained from sources that Engineered Portfolio considers to be reliable; however, Engineered Portfolio makes no representation as to, or accepts any responsibility or liability for, the accuracy or completeness of the information contained herein or any decision made or action taken by you or any third party in reliance upon the data. Some results are derived using historical estimations from available data. Investment recommendations may change and readers are urged to check with tax advisors before making any investment decisions. Opinions expressed in these reports may change without prior notice. This memorandum is based on information available to the public. No representation is made that it is accurate or complete. This memorandum is not an offer to buy or sell or a solicitation of an offer to buy or sell the securities mentioned. The investments discussed on this site/blog may be unsuitable for investors depending on their specific investment objectives and financial position. Past performance is not necessarily a guide to future performance. The price or value of the investments to which this report relates, either directly or indirectly, may fall or rise against the interest of investors. All prices and yields contained in this report are subject to change without notice. This information is based on hypothetical assumptions and is intended for illustrative purposes only. PAST PERFORMANCE DOES NOT GUARANTEE FUTURE RESULTS.

August 9, 2016 at 1:04 pm
Great post, very easy to understand and comprehend.
LikeLike
August 9, 2016 at 1:05 pm
Great post,very easy to understand!
LikeLike
August 10, 2016 at 11:58 pm
Great information here. Looking forward to more insightful posts!
LikeLike
August 11, 2016 at 2:20 am
Thanks, we are hard at work on more posts!
LikeLike
April 8, 2019 at 3:06 pm
Eye opening. Thanks!
LikeLike