
Buying an S&P 500 index fund is boring yet simple. In the world of investing, boring and simple generally means inexpensive yet high returns. But if its too boring, excitement seeking humans (like myself) may opt for “sexier” investment opportunities.
The trouble is that sexy stocks and “strategies” are both expensive and their returns are underwhelming. But can we apply some lessons learned from previous analysis to make a boring and simple investment strategy… fun and exciting!?
The middle of the US stock market offers some clear advantages as I’ve demonstrated. Mid-cap value and small-cap value are historically the best style boxes. And our sector analysis has highlighted how boring stocks (like consumer staples and health care) have historically offered the best returns. Can we combine some lessons learned from this analysis to engineer an index of boring stocks while maximizing some sexy returns?
That’s what I will do in this post. I’ll apply lessons learned from historical analysis with common sense and engineer a few indexes that are simple enough to track in real life. Real data and results are used, provided by Quantopian’s development platform.
So let’s get coding and design a couple engineered indexes!
Our Universe: Mid & Small Cap Value
History has told us that mid & small cap value have offered out-sized returns for the level of risk they require consistently for 80 years. To demonstrate this, I’ve applied the following filters and built a simple index in Quantopian:
- S&P 1500
- No large cap
- No growth or blend (only value)
- Market-cap weighted
- Monthly rebalance

So this is the area of the US equity market where we want to live. Let’s apply some additional filtering to further engineer this index.
Adding Filters and Factors
Fundamentals
First I’m going to remove junk stocks based on fundamentals. A lot of stocks in the value space have fundamentals that warrant their undervaluation; but about half of them have at least average fundamental metrics to their peers. Below I’ve applied the filter to remove stocks with below average fundamentals.

Adding in fundamental filters reduces our overall returns; but it also reduces risk levels. Most useful is that it narrowed the number of companies to consider down to about 150.
Low-Volatility Factor
There are four documented investment factors that generate returns which are contrary to the efficient market theory. These factors are generally well accepted, yet they continue to generate higher risk-adjusted-returns; and for some reason, the stock market hasn’t priced out the inefficiency. Here they are:
- Value: Undervalued stocks outperform growth, that’s why we’re in value
- Size: Smaller companies tend to outperform large (but they do require more risk so this is inline with the efficient market theory), that’s why we got rid of large cap
- Momentum: Our theory on the middle of a market cap weighted index takes advantage of momentum in stocks
- Low-volatility: Stocks with less price volatility (less risk) tend to out-perform stocks with high price volatility (high risk)
Volatility is interesting. It suggests that boring stocks are better. We’ve found that mid-cap value, arguably the most boring and under-covered area of the market has generated the highest risk-adjusted returns. And then when we did the sector analysis, the same theme presented itself: boring is better. Consumer staples, an incredibly boring-yet-stable sector, has outpaced every other sector in the last 40 years. I like being a contrarian investor and buying boring stocks, so let’s see how this factor does in our already filtered equity world.

Woah, check out the reduction in risk! The volatility goes down by 25% but more impressive is how the maximum drawdown is improved from a 68% loss to a 49% loss during the financial crisis. What’s most impressive to me is that this index is only comprised of 30 stocks, a relatively manageable amount to invest in and monitor.
Apply Filters & Factors by Sector
The trouble with the previous three examples is that there is no effort taken to ensure the index isn’t over or under weighted to each sector. I want to engineer an index that is fairly evenly weighted to each sector; I also want to have an index of only 20 stocks which will be easy for me to replicate in real life trading. So let me do the following, per sector, filtering to engineer our index.
- Average or better fundamentals
- Low volatility
- Middle of mid & small cap
- Undervalued
Engineered Sector Index Returns
How did these engineered sector indexes do for a $10K initial investment?

Although this looks like a cool plot, a better way to quantify the effectiveness of our engineered sector index returns is to compare them to their large cap sector counterpart.
Engineered Sectors Compared to their Benchmark
In this comparison, summarized in the table below, we see that an alpha is generated in every sector except technology (telecom is combined here because of how few telecom companies that enter the mid-cap value space). But for technology the risk level is greatly reduced so we’re not left with a negative alpha.

Risk vs Return per Engineered Sector
Now let’s generate a scatter plot of the average monthly return vs the volatility of those returns to compare sectors to each other.

I prefer to plot the annualized return against the downside risk which I’ve done below. The downside risk was calculated by taking the root-mean-square of monthly losses. This weights the frequency of losses and the severity which investors care more about than upside volatility.

What jumps out to me in these plots is how our engineered financials index exhibits very low risk levels. Wait, I thought the financial crisis hit the financial sector the hardest? It did… but our low volatility, fundamental, value, and middle filtering avoided the carnage. How? Because it was buying more stable financial companies like insurance companies that were less impacted by the carelessness of our banks.
Correlation Matrix
Below I generated a correlation matrix of the monthly returns between our engineered sectors. What’s amazing to me is how uncorrelated these are with one another! This presents a significant diversification benefit when we add these sectors together.

Engineer an Index
How Many Securities?
There are a number of academic studies out there (here’s one from where the below plot is taken) that have looked at the relationship between risk or variation and the number of stocks/securities owned in the portfolio. The more companies owned, the less specific risk the investor has to take on. But the relationship between number of holdings and risk is not linear.
In the plot below you can notice a drastic drop in risk from 1 holding to about 5. Then from 5 to 20 holdings there is a somewhat linear relationship. But after 20 stocks, the reduction of risk for every additional stock owned becomes negligible. We see this plot and conclude that at maximum, our index should have 20 stocks. But we also notice that at minimum an index can have 5 companies. If there is a relationship between risk and return, taking on more risk with only 5 companies may offer more returns. So we’re going to build three indexes: 20 stock, 10 stock, and 5 stock indexes.

Engineered 20 Stock Index
Now let’s bring our engineered sectors together in a relatively even weighted index. You would think that the total returns would be an average of the above engineered sector returns which works out to 537%. But I’m going to reapply our volatility and middle factors to get down to only 20 stocks and let the sectors work against each other to improve our returns.

If I do say so myself… this is an impressive index! The above returns were generated with a 20 stock market-cap weighted index that is rebalanced monthly with simple market orders. Why not track this index instead of the, apparently less efficient, S&P 500?
Engineered 10 Stock Index
I still think back to the sector analysis I did and want to further simplify this index. There were 2 sectors that had jumped out to me from that: consumer staples and health care. But I can’t have a completely defensive strategy or I may abandon it during market upswings and then lose the advantage the defense offers. So I want to add in two more sectors:
- Consumer Discretionary: This sector is very well correlated to the stock market, and when the low-volatility factor is applied I’m ensuring that I’m buying companies that are stable and therefore selling products/services that are less influenced by macro-economic events.
- Energy: This is the opposite of the other three sectors. The other three sectors are people-focused; they are primarily exposed to consumers and population growth. Energy stocks have a direct exposure to the price of commodities, specifically oil. They also have exposure to business and industry a little more directly than the other three sectors. Energy is remarkably uncorrelated; and a lack of correlation is good. The energy sector has also exhibited a long history of offering appropriate returns for the level of risk required.
Someone may be quick to point out that there is look back bias with these sectors; and I agree. But remember that I have >40 years of “look-back bias” that has pointed me to these sectors. And a combination of these 4 still offers significant diversification benefits, just check out how uncorrelated these are!

So let’s only use these 4 sectors that are very uncorrelated and together offer a fairly diversified portfolio. And because we’ve reduced the sectors, I’m able to reduce the number of holdings to only 10.
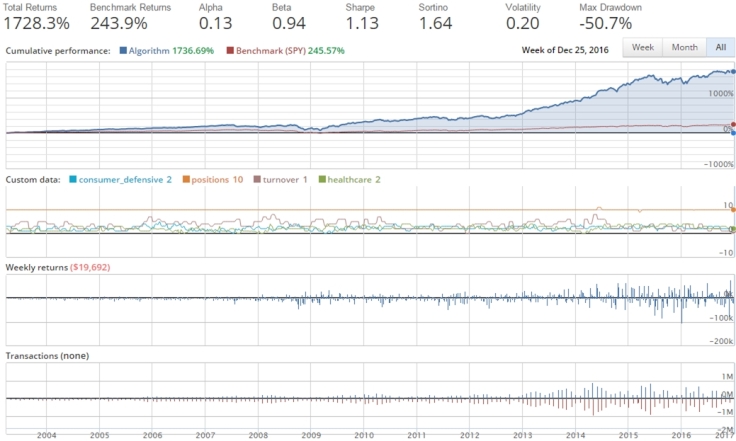
Watch out! This index of only 10 stocks has historically (only 14 years) offered an ungodly 13% alpha over the S&P 500. And this was achieved with only 10 stocks, market cap weighted, and rebalanced monthly.
Engineered 5 Stock Index
Now here’s where we get a little crazy and use our middle theory to go down to only 5 stocks. This will increase our volatility and company specific risk but… it offers significant returns.
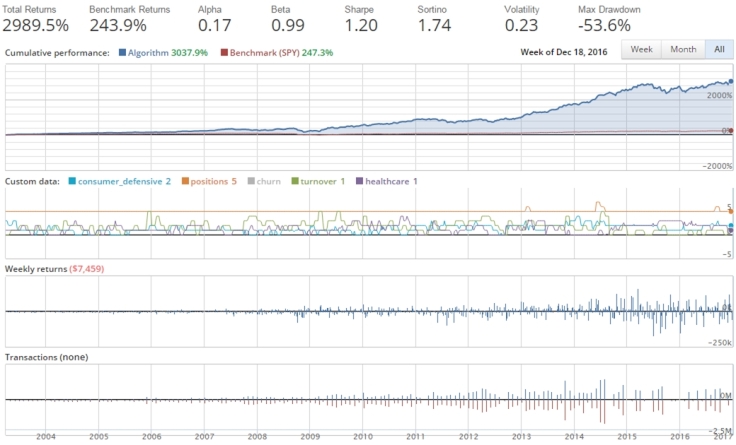
This index of only 5 companies has more risk and volatility compared to the other two engineered indexes; but with a long time horizon the returns its generated have provided a 10 times multiple over the S&P 500.
Performance Metrics
Let’s compare these engineered indexes to the S&P 500 and to the S&P 400 value indexes. What are the total returns of a $10K investment? And what have been the risk-reward characteristics of our indexes?
Total Returns

A $10,000 invest in the S&P 500 back in April 2003 would now be worth $34K. Mid cap value (S&P 400 value) has done noticeably better and your investment would be worth $46K. But an investment in our 20 stock engineered index would now be worth $77K, one in our 10 stock index would now be worth $184K and one in our 5 stock index would now be worth a whopping $308K!
Trailing 12 Month Alpha and Beta
Beta is an attempt to measure risk relative to the overall stock market. A negative beta means that an investment moves in the opposite direction of the overall market. A beta of 1 means that it moves in unison with the market. And a low beta means that it is correlated to the market; but it moves less drastically.
Alpha looks to quantify the level of outperformance for the level of risk required. In a purely efficient market, there should be no such thing as alpha… clearly we’ve found an inefficient area of the market. Check out the trailing beta and alpha of our indexes.

Notice how consistent the alpha is of the 20 stock index and how relatively low the beta is over time. The 10 stock engineered index starts exhibiting some erratic trailing alpha and beta but it still is able to average out an alpha of 13%. The 5 stock index is most eratic but averages an alpha of 17%. All three of these indexes have had periods of alpha less than 0; but those periods have historically been short lived.
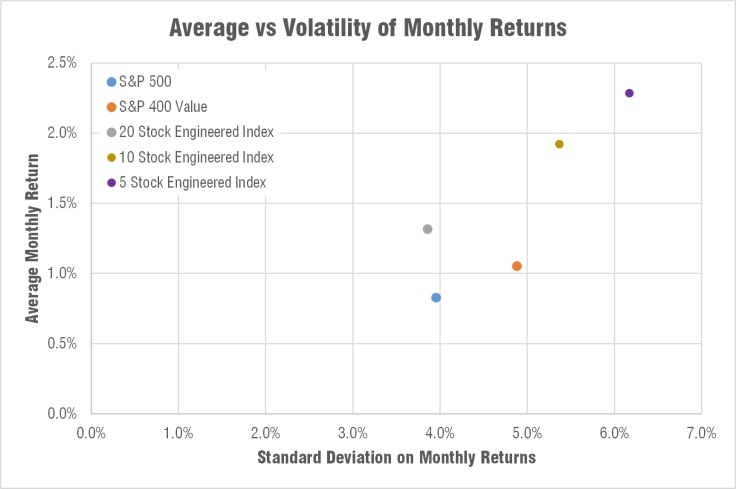
Risk Adjusted Returns
Another way to look at risk vs return is to plot the average return against the volatility of those returns. I’ve done that below and you’ll notice the substantial outperformance of the 20 stock engineered index yet its been less volatile than the S&P 500. The other two indexes are quite a bit more volatile; but they have awarded their investor appropriately for that added risk.
Now let’s look at annualized return vs downside risk below. Here we still have an appropriate relationship between risk and return for our indexes; but that relationship is quite a bit steeper compared to the S&p 500 and S&P 400 value. What I mean is that your compensation for taking on more risk in our engineered indexes is drastically more than the compensation you earn going from S&p 500 to the S&P 400 value.

Which one is right for me?
That’s for you to decide based on your own personal risk tolerance. Let’s summarize the options.
- Thanks but no thanks – You don’t trust two engineers with no professional/formal investment training… I don’t blame you. But let’s see how this does in time. We’ll provide an update on how these indexes are doing every 6 months and hopefully, with time, we’ll be able to demonstrate that these indexes offer an appealing opportunity to consider adding to your investment portfolio
- They all seem too risky – Maybe this blog interested you but you are very risk adverse and don’t want to deal with the swings. There are a couple options that I go over in my next post. For one we can add a hedging element to eliminate our sector specific risk. Or, my preference, we can reduce risk by adding in uncorrelated asset classes like bonds, international equities, and gold.
- 20 stock engineered index – This one is the hardest to poke holes in. It’s well diversified across sectors; it has enough holdings to reduce company specific risk; its buying stocks with low volatility, good fundamentals, and undervalued per sector; and… it’s offered over 5% more annualized returns compared to the S&P 500. The only trouble with this one is that it will be a bit of work to manually replicate because you will still need to keep track of 20 stocks.
- 10 stock engineered index – Here’s where we make a bit of sector bet and reduce our holdings to only 4 sectors. If this scares you, stick with the 20 stock version. If you can get behind sectors that offer products that the global population has an inherent need for (consumer staples, health care, consumer cyclical, and energy) then this is the way to go.
- 5 stock engineered index – You first need to buy into our sector bet based off historical data. Then get a little wild and crazy and only hold 5 companies. This will be volatile but its volatility has more than provided adequate return. Most impressive of this index is that it’s the easiest to follow… there’s only 5 companies!
How will it do in the future?
I have no idea what the future will bring. Anyone who tells you otherwise is either an idiot or dreaming. But I can say that history has suggested the principals used are not a fluke.
Mid cap has been the darling of the stock market and somehow not attracted much attention in the process; these stocks are boring.
Undervalued stocks have been also proven to outperform overvalued (growth) stocks yet somehow people keep buying growth stocks. Why? Because growth is sexy and value is boring.
Stocks with low recent price volatility has also been surprisingly shown to out-perfom volatile stocks. Some suggest that a low volatility approach is really a different way of finding undervalued stocks. But in this post I highlighted how finding low volatile stocks already in the value space can amplify returns. Why? Because this approach ensures we buy the most boring of the boring stocks.
Boring stocks are less likely to be influenced by outside factors and they are less likely to be caught up in emotion-induced massive booms and busts. I don’t know what will happen next year; but I have confidence in the merits of a boring strategy when applied to a long term investment outlook.
Where can I invest?
There are a couple options available if what I’ve just laid out sounds intriguing.
- Copy It – The filtering and factoring I’ve done is fairly straightforward (which is why it should continue to outperform). So if you have a familiarity with writing code and are excited/interested in investing, I’d suggest that you set up a Quantopian account, write some code based upon what I’ve just laid out, and link it to a Robinhood brokerage account. If you’re like me, you’ll find this process fun! If you’re willing to share any themes you find, we’d love to hear about them!
- Email Subscription – Another option is for us at engineered portfolio to monthly tell you which stocks come out of these filters. Such an approach is very low risk for both us and a potential investor, he/she can chose to do what they’d like with the indexes’ stocks. A low risk and simple approach also means a cheap/free one. As we look to build interest we can offer such a service for free in the beginning.
I am replicating these indexes in a Robinhood account (free transaction costs) and letting the index/algorithm automatically buy for me. I’m also manually buying these stocks monthly in my and my wife’s Roth IRAs. I’m proud of the work and analysis I’ve done and look forward to benefiting from it. Most of all… I love being a contrarian investor. I love buying boring stocks that not many people seem to care about. And this has made investing more fun for me which has resulted in me investing more.
This is the intangible component of the engineered indexes. It motivates you to invest. The engineered indexes make boring investing fun. And they (historically) have offered very high returns. You might be buying boring companies; but the returns have been higher historically and they may help you remain engaged and excited. Doesn’t get much sexier than that!

Disclosures
The author(s) of this site have no formal financial investing training or certifications. The content on this site is provided as general information only and should not be taken as investment advice. All site content shall not be construed as a recommendation to buy or sell any security or financial instrument, or to participate in any particular trading or investment strategy. The ideas expressed on this site are solely the opinions of the author(s) and do not necessarily represent the opinions of sponsors or firms affiliated with the author(s). The author may or may not have a position in any company or advertiser referenced above. Any action that you take as a result of information, analysis, or advertisement on this site is ultimately your responsibility. Consult your investment adviser before making any investment decisions. This site/blog contains the current opinions of the author; the author’s opinions are subject to change without notice. This site is for informational purposes only and should not be considered as investment advice or a recommendation of any particular security, strategy or investment product. The charts and comments are only the author’s view of market activity and aren’t recommendations to buy or sell any security. Market sectors and related ETFs are selected based on his opinion as to their importance in providing the viewer a comprehensive summary of market conditions for the featured period. Chart annotations aren’t predictive of any future market action rather they only demonstrate the author’s opinion as to a range of possibilities going forward. All material presented herein is believed to be reliable but we cannot attest to its accuracy. The information contained herein (including historical prices or values) has been obtained from sources that Engineered Portfolio considers to be reliable; however, Engineered Portfolio makes no representation as to, or accepts any responsibility or liability for, the accuracy or completeness of the information contained herein or any decision made or action taken by you or any third party in reliance upon the data. Some results are derived using historical estimations from available data. Investment recommendations may change and readers are urged to check with tax advisors before making any investment decisions. Opinions expressed in these reports may change without prior notice. This memorandum is based on information available to the public. No representation is made that it is accurate or complete. This memorandum is not an offer to buy or sell or a solicitation of an offer to buy or sell the securities mentioned. The investments discussed on this site/blog may be unsuitable for investors depending on their specific investment objectives and financial position. Past performance is not necessarily a guide to future performance. The price or value of the investments to which this report relates, either directly or indirectly, may fall or rise against the interest of investors. All prices and yields contained in this report are subject to change without notice. This information is based on hypothetical assumptions and is intended for illustrative purposes only. PAST PERFORMANCE DOES NOT GUARANTEE FUTURE RESULTS.

March 10, 2017 at 12:19 am
Great post. =)
It would be great if you emailed the stocks for each portfolio or provided a list on your site.
Can you create links to your Quantopian algos and maybe we can just follow them?
For those who pay 5$ to 10$ a trade how much does the affect portfolios of 10k or 100k+?
LikeLike
January 8, 2018 at 3:20 am
Great article! How can I get a list of the 5, 10 and 20 stocks on a monthly basis. I did “subscribe” but have not received any stock lists yet.
LikeLike
January 29, 2018 at 3:00 pm
How do I subscribe to your monthly email on engineered index stocks?
LikeLike
July 23, 2018 at 4:43 am
Excellent logical process. I was curious, what criteria were used to exclude companies with poor fundamentals? The other exclusion criteria were straight forward, but I’m curious what particular financial data was used to filter here. Additionally, I am curious about what the re-allocation timing does to the overall returns (i.e. quarterly instead of monthly). This may be useful for readers who don’t use robinhood and want to factor in transaction cost and may offer some marginal tax advantages. Thanks for the read and your time!
LikeLike
March 19, 2019 at 8:20 pm
Is there anyway for you to give out more information on the filtering coding so I could replicate this on my own each month? Thanks.
LikeLike
March 23, 2019 at 6:27 pm
Here you go John, just posted in quantopian – it was a nice idea but I’ve turned to accelerating dual momentum after learning some hard lessons!
https://www.quantopian.com/posts/12-percent-alpha-5-stocks-rebalance-monthly-the-dangers-of-over-fitting
LikeLike