
Everyone has heard of the investment adage to “buy low, and sell high.” But it’s very difficult to execute in practice. But the mid-cap value index buys low and sells high automatically for its investor.
In this blog I’ll explain why this area of the equity market is so proficient. But I won’t stop at some simple conjecture, I’ll prove this functionality in other areas of the market. Not only that, we’ll go over a way to capitalize on the mid-cap value’s inherent genius.
Entries into the Index
How do companies enter the mid-cap value index from other areas of the equity universe? Do the entry avenues give an indication of some intelligent buying “algorithm?” As I’ll explain below, 2 of the 3 entry directions into a mid-cap value index are forcing the index to “buy low.”

1. Buy Low: Large Cap Value Price Dips
The first entry point is when large cap value stocks drop in market capitalization. This happens when the stock’s price drops. One would argue that the collective opinions of stock analysts are accurately valuing the company and that it should have dropped for a reason. But there is also a momentum element to stock price fluctuation that is very well documented.
Just like how there can be booms in stock prices due to human emotion, there can be oversold busts and drops. As analysts see a stock dropping they may be tempted to get out of the stock before it keeps dropping. And this repeated exiting of a stock will drive prices down further until eventually it bottoms. Once it reaches the bottom analysts will feel comfortable again to start buying until the stock returns to its fair value. But timing this “bottom” is difficult, if not impossible. And buying a stock as its dropping will be very difficult for a human to do, it’s ugly. The mid-cap value index doesn’t care though about human emotion; it doesn’t care how attractive or “sexy” the investment is. If a large-cap value stock dropped in price, and thus dropped in market capitalization, it will eventually become a mid-cap value stock. There’s a chance that stock will continue dropping; but it’s more likely that the price will bottom out and eventually return. Mid-cap value index just bought low for you without any thought or hesitation.
2. Buy Low: Mid-Cap Stock Becomes Attractively Valued
Mid-cap stocks that are once valued at “average” levels to its peers (price to earnings, price to sales, price to book etc.) can move left into mid-cap value when its valuation levels become depressed relative to its peers. This can happen from price drops; but it can also occur when its earnings rise at a higher rate than its price.
Again this entry is boring and ugly. You’d be forced to be buying a company that for some reason is being ignored by the general investment community. And they will be ignoring it for likely a subjective reason, whereas the mid-cap value index only cares about objective metrics. If the stock is undervalued in objective measures relative to its peers, mid-cap value will buy it. It buys these companies at a relatively low valuation and therefore a relatively low price. Again, it buys low for you.
3. Small-Cap Value Stocks with Momentum
Here’s the one entry point that actually is “sexy.” If a small-cap value stock starts outpacing its peers in price performance and therefore grows its market capitalization faster… it will eventually become a mid-cap value stock. And a mid-cap value index fund will be forced to buy that stock. It’s buying smaller companies with more upward price momentum than its peers. So this is buying at a peak; but its only buying the peak of companies that are smaller and undervalued relative to its peers.
Exits out of the Index
Exits out of the mid-cap value index are also attractively structured. Two of the three directions out, cause the index to “sell high.”

4. Sell High: Mid-Cap Value Price Rise
The first exit is when a mid-cap value stock rises faster in market capitalization relative to its peers. This happens when the stock’s price has rose faster than its peers. Again, this is hard for a human to let go of his/her emotion and sell this winning stock.
A human investment adviser/manager will have a hard time selling a company that they may have bought when it was undervalued and much smaller. Now months or even years later, the stock has come around and grown faster than its peers; this stock is one of your best performers… and now its a “large cap” stock and too big to keep in a mid-cap index. The mid-cap value index doesn’t have any emotional attachment to this stock, it’s too big and therefore it’s being sold. The mid-cap value index just forced you to sell the stock at a peak, or at least at a significantly higher point to where you bought it. It sold high.
5. Sell High: Mid-Cap Valuation Increase
Mid-cap value stocks can also exit to the “right” when their valuation metrics increase relative to its peers to a more average level. Maybe it has been on a surge and other investors have caught wind and started buying the stock to further drive up price and therefore its valuation metrics.
Again this exit is going to be hard for a human to let go of. One of the stocks that they picked has finally started to gain some attraction from other investors… I want to hang on for the ride! But the mid-cap value index again doesn’t care. If the stock is no longer undervalued relative to its peers the index will sell it. It will again force you to sell high.
6. Stop Loss: Price Drop
The only “unattractive” means of exiting a mid-cap value index is when the stock price has dropped, now relegating the company to small-cap. A human will again have a hard time letting go of a stock, it’s easier to buy then to time when to sell. And if the investor believes in the stock he/she may be inclined to keep it with the belief that it will come back in price. And that might eventually happen but…
If you are inclined to hold on to this loser you will not be afforded the opportunity to buy a small-cap value company that just rose up and replaced this loser of ours. The mid-cap value index is diligent enough to recognize this opportunity forcing a sell of the stock with downward momentum and buying the stock with upward momentum. It also prevents you from holding on too long to a losing stock; so there is a built-in means of placing stop loss orders.
Prove It: Construct an Index
S&P 167: Middle of the S&P 500
To prove the effectiveness of being in the middle, let’s use Quantopian to build an index that tracks the middle 167 companies (middle third) in the S&P 500. In the first plot I constructed an index to track the S&P 500; it buys and sells monthly, weighting the companies based upon market capitalization. The next plot though takes that same code/algorithm but buys the middle 167 companies based on market cap. Buying the middle increased your beta; but the investor was more than compensated and earned an alpha of 2%!
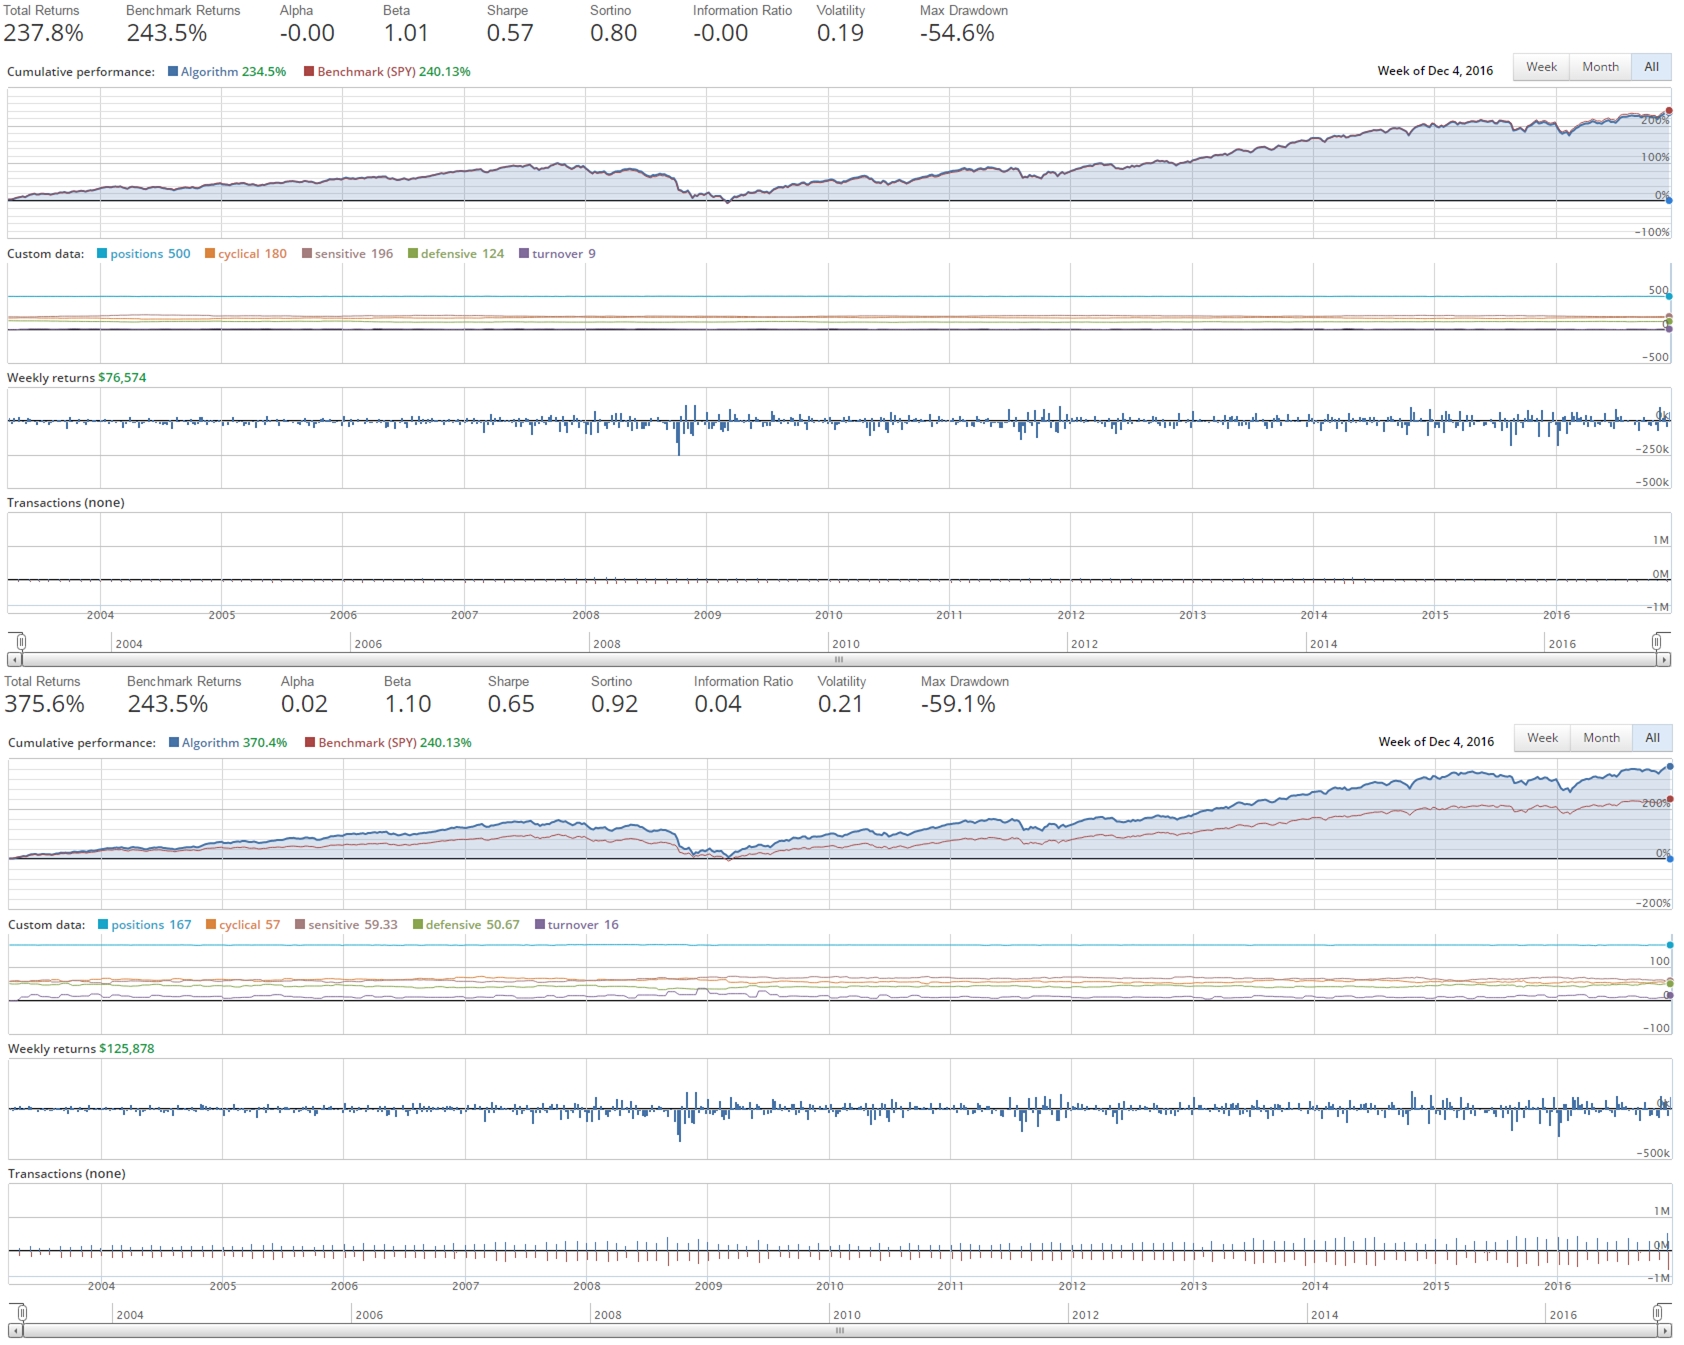
A $10,000 investment in the S&P 500 on April 1st 2003 would now be worth roughly $34,400. But an investment in this constructed S&P 167, or middle third of the S&P 500, would now be worth $47,600.
S&P 33: Middle of the S&P 100
One may argue that I have some look-back bias here because mid-cap and small-cap stocks did better than large cap in the last 14 years. My response to that is… well of course they have, mid-cap and small-cap stocks have a strong history of outperformance! But fine, let’s take this a step further and test the middle of mega-caps.
The S&P 100 tracks the largest 100 companies of the S&P 500. Let’s see if the middle 33 companies of the largest 100 will outperform the entire 100.
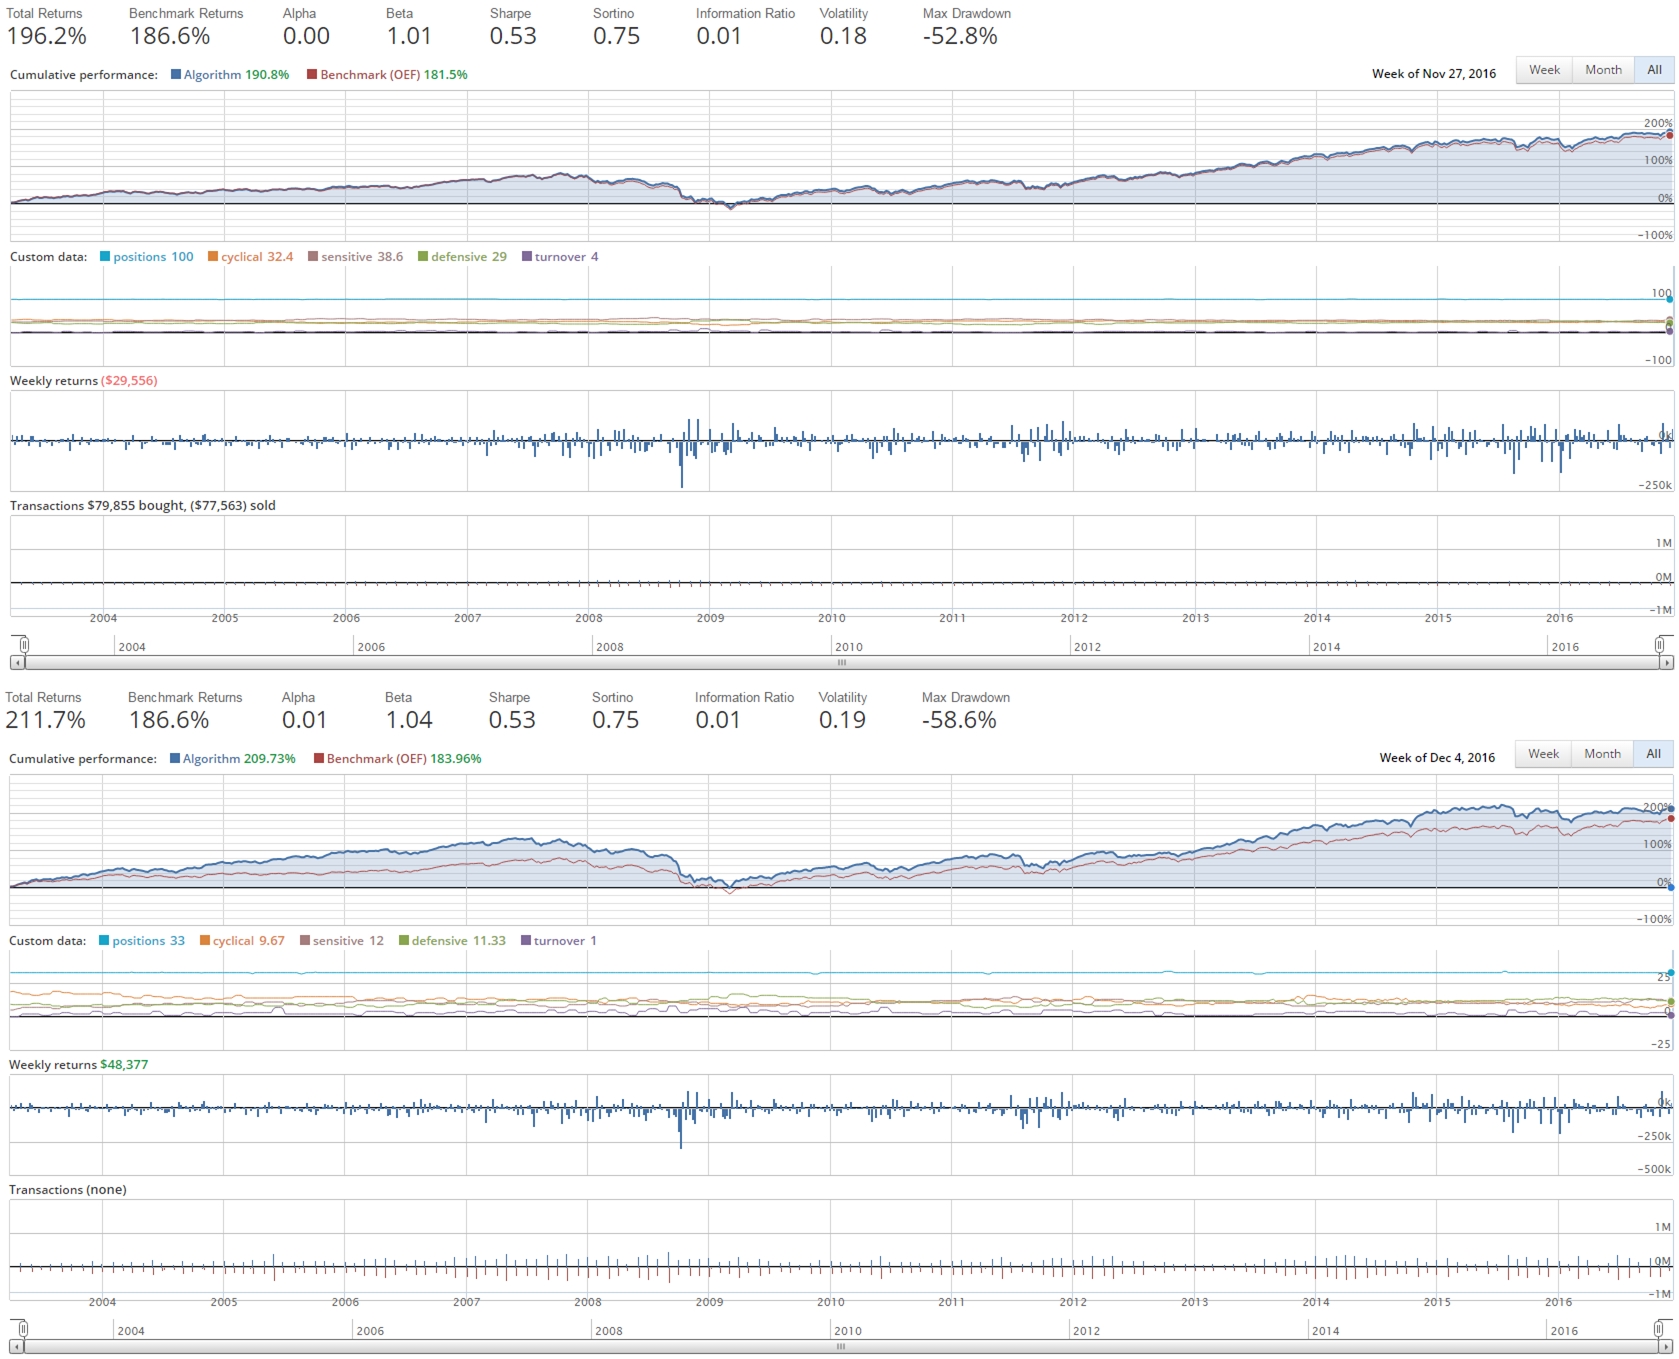
Using the benchmark of iShares OEF which tracks the S&P 100, my index of the middle 33 consistently outperforms and provides an alpha of 1%. Again, the middle works, even when tracking the biggest of the biggest companies in the world!
Middle 60 of Mid-Cap Value and Small-Cap Value
As we demonstrated in our stock style/size historical analysis, the middle will always work. But does the middle of the middle compound the outperformance?
In the next test I’m going to take the middle stocks of the mid-cap value and small-cap value universe. You may first argue that small cap stocks aren’t the middle; but you’d be forgetting micro-caps. In this analysis I’ll be first starting by taking only stocks in the S&P 1500. This index has already filtered out the micro-caps, smaller companies with relatively low valuations and liquidity than their peers. What’s interesting to first note is that micro-cap stocks are a poor investment. Historically they are much riskier than small-cap and offer less returns. Check out this plot that compares the IWC micro-cap ETF to iShares mid-cap and small-cap index ETFs.
So let’s take the mid-cap value and small-cap value stocks in the S&P 1500 and weight them by market capitalization. This constructed index’s returns are compared to that of IJJ, a mid-cap value index ETF below. There’s a slight amount of outperformance; but no alpha because the investor was taking on a little more risk with the smaller companies. Now apply what we’ve learned about the middle, and hold the middle 60 companies in this index, check out the returns!

A $10,000 investment in the best performing mid-cap value index fund, IJJ, back in April of 2003 would now be worth about $47,100. But an investment in an index that tracks the middle 60 stocks would now be worth about $58,400! That’s quite a lot more money that your investments would now be worth in a relatively short period of time!
What about taxes and fees?
A naysayer will see these plots and be quick to point out that they didn’t include fees or taxes. Well thankfully there is Robinhood that offers truly free stock trades. And what’s more, a simple algorithm in Quantopian can link to Robinhood and execute the necessary trades to buy and sell companies that enter or exit our index. This is all done for free.
Taxes are admittedly a bit more difficult to argue. This index is buying and selling companies on a monthly basis and therefore generating some taxable gains; but remember so doesn’t every index fund out there. When you invest in a mutual fund or ETF, the fund/ETF will be buying and selling companies and therefore generate some taxable gains that you will be liable for. The taxes for this will be a little higher; but because I’m owning individual securities I have the opportunity to do some tax loss harvesting that we can discuss in a later post.
Can we further engineer this index?
After seeing the larger returns we can generate from some simple tweaks to the mid-cap value and small-cap value index, we can’t help but wonder if we can squeeze out even better performance! A couple of things specifically could be done to improve this engineered index:
- Stock filters based upon fundamentals to reduce “junk”
- Apply lessons learned from sector analysis: boring is good
In my next post I apply these added smarts to engineer our own index!

Disclosures
The author(s) of this site have no formal financial investing training or certifications. The content on this site is provided as general information only and should not be taken as investment advice. All site content shall not be construed as a recommendation to buy or sell any security or financial instrument, or to participate in any particular trading or investment strategy. The ideas expressed on this site are solely the opinions of the author(s) and do not necessarily represent the opinions of sponsors or firms affiliated with the author(s). The author may or may not have a position in any company or advertiser referenced above. Any action that you take as a result of information, analysis, or advertisement on this site is ultimately your responsibility. Consult your investment adviser before making any investment decisions. This site/blog contains the current opinions of the author; the author’s opinions are subject to change without notice. This site is for informational purposes only and should not be considered as investment advice or a recommendation of any particular security, strategy or investment product. The charts and comments are only the author’s view of market activity and aren’t recommendations to buy or sell any security. Market sectors and related ETFs are selected based on his opinion as to their importance in providing the viewer a comprehensive summary of market conditions for the featured period. Chart annotations aren’t predictive of any future market action rather they only demonstrate the author’s opinion as to a range of possibilities going forward. All material presented herein is believed to be reliable but we cannot attest to its accuracy. The information contained herein (including historical prices or values) has been obtained from sources that Engineered Portfolio considers to be reliable; however, Engineered Portfolio makes no representation as to, or accepts any responsibility or liability for, the accuracy or completeness of the information contained herein or any decision made or action taken by you or any third party in reliance upon the data. Some results are derived using historical estimations from available data. Investment recommendations may change and readers are urged to check with tax advisors before making any investment decisions. Opinions expressed in these reports may change without prior notice. This memorandum is based on information available to the public. No representation is made that it is accurate or complete. This memorandum is not an offer to buy or sell or a solicitation of an offer to buy or sell the securities mentioned. The investments discussed on this site/blog may be unsuitable for investors depending on their specific investment objectives and financial position. Past performance is not necessarily a guide to future performance. The price or value of the investments to which this report relates, either directly or indirectly, may fall or rise against the interest of investors. All prices and yields contained in this report are subject to change without notice. This information is based on hypothetical assumptions and is intended for illustrative purposes only. PAST PERFORMANCE DOES NOT GUARANTEE FUTURE RESULTS.

Leave a comment