Portfolio management is neither an art nor a science. It is instead an unusual problem in engineering, determining the most reliable and efficient way to reach a specified goal, given a set of policy constraints, and working within a remarkably uncertain, probabilistic, and always changing world of partial information and misinformation, all filtered through the inexact screen of human interpretations.
-Charles Ellis in Winning the Loser’s Game
The Methodology
We’re engineers, so we approached asset allocation like an engineering problem: define your objectives and constraints, research the feasible possibilities – then simulate and optimize.
Objectives
- Maximize 4 returns metrics:
- Average annual return
- Annualized return (CAGR)
- Average 10 year return
- Worst 15 year return
- Minimize 4 risk metrics:
- Volatility (standard deviation) of annual returns
- Downside risk (RMS of losses)
- Volatility of 10 year returns
- Largest drawdown (the worst peak to trough)
Constraints
- Only allow weightings of 10 or 20% per asset class
- Don’t over complicate
- Ensure maximum diversification
Research The Possibilities
- Analysis of bond performance
- Analysis of US size/style performance
- Analysis of US sector performance
- Analysis of ex-US stock performance
- Analysis of diversification/alternative assets
Simulate & Optimize
We created literally millions of portfolio combinations that met our constraints and gave scores based on our objective metrics and the portfolio’s relative performance to other portfolio candidates. Performance data were analyzed from the start year of 1972 through the end of 2016. Then we optimized for 6 different time horizons:
- 1 year (savings)
- 2 years (conservative income)
- 3 years (income)
- 5 years (conservative growth)
- 10 years (growth)
- 20 years (aggressive growth)
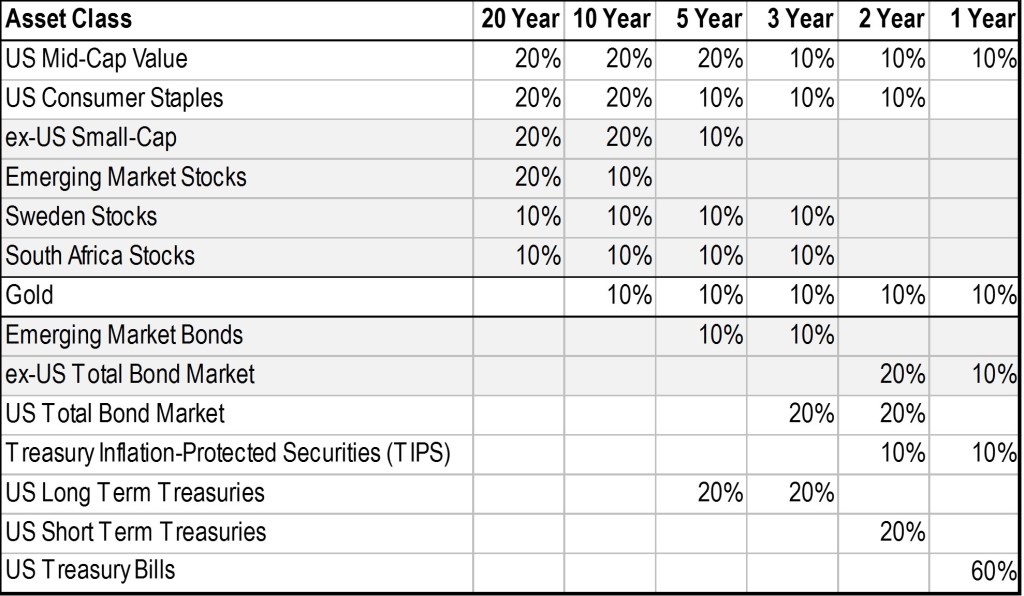
Our Engineered Portfolios
Our portfolios are simple, yet they include asset classes most investment advisers either haven’t considered or are afraid to include. We aren’t emotional investors with a formal financial education, we’re just engineers that looked at numbers and derived the optimal combinations of unique asset classes that are highly uncorrelated.

What makes our portfolios so efficient is how uncorrelated the assets we use are. Included for reference is the total US and total ex-US stock markets, although these assets are not included in any of our portfolios.

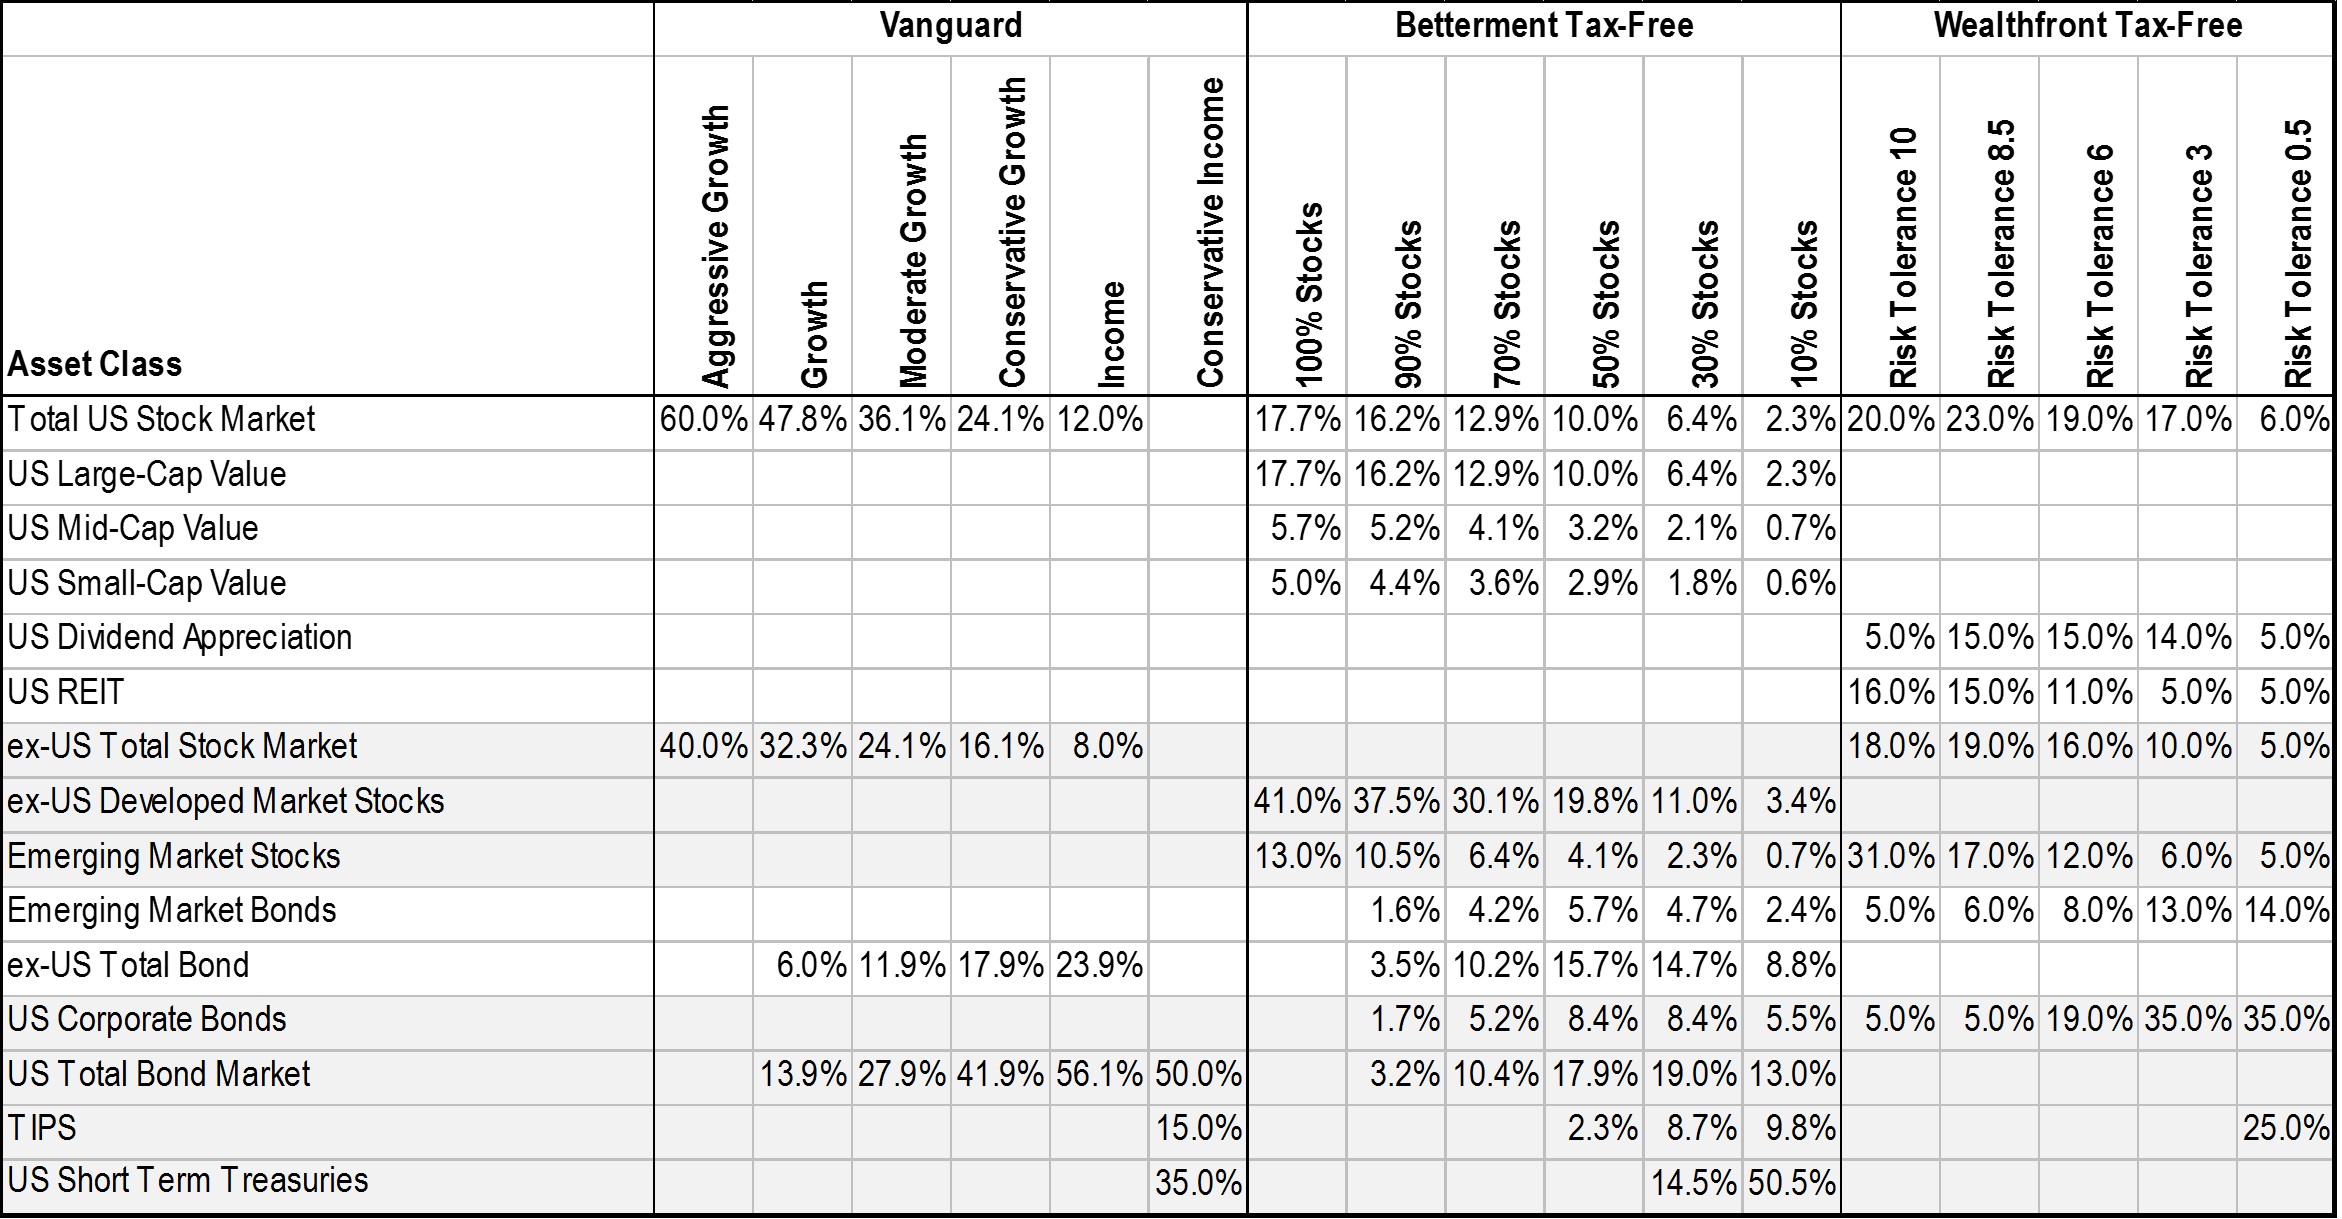
Other “Standard” Portfolios
Below are the portfolio combinations recommended by Vanguard, Betterment, and Wealthfront.
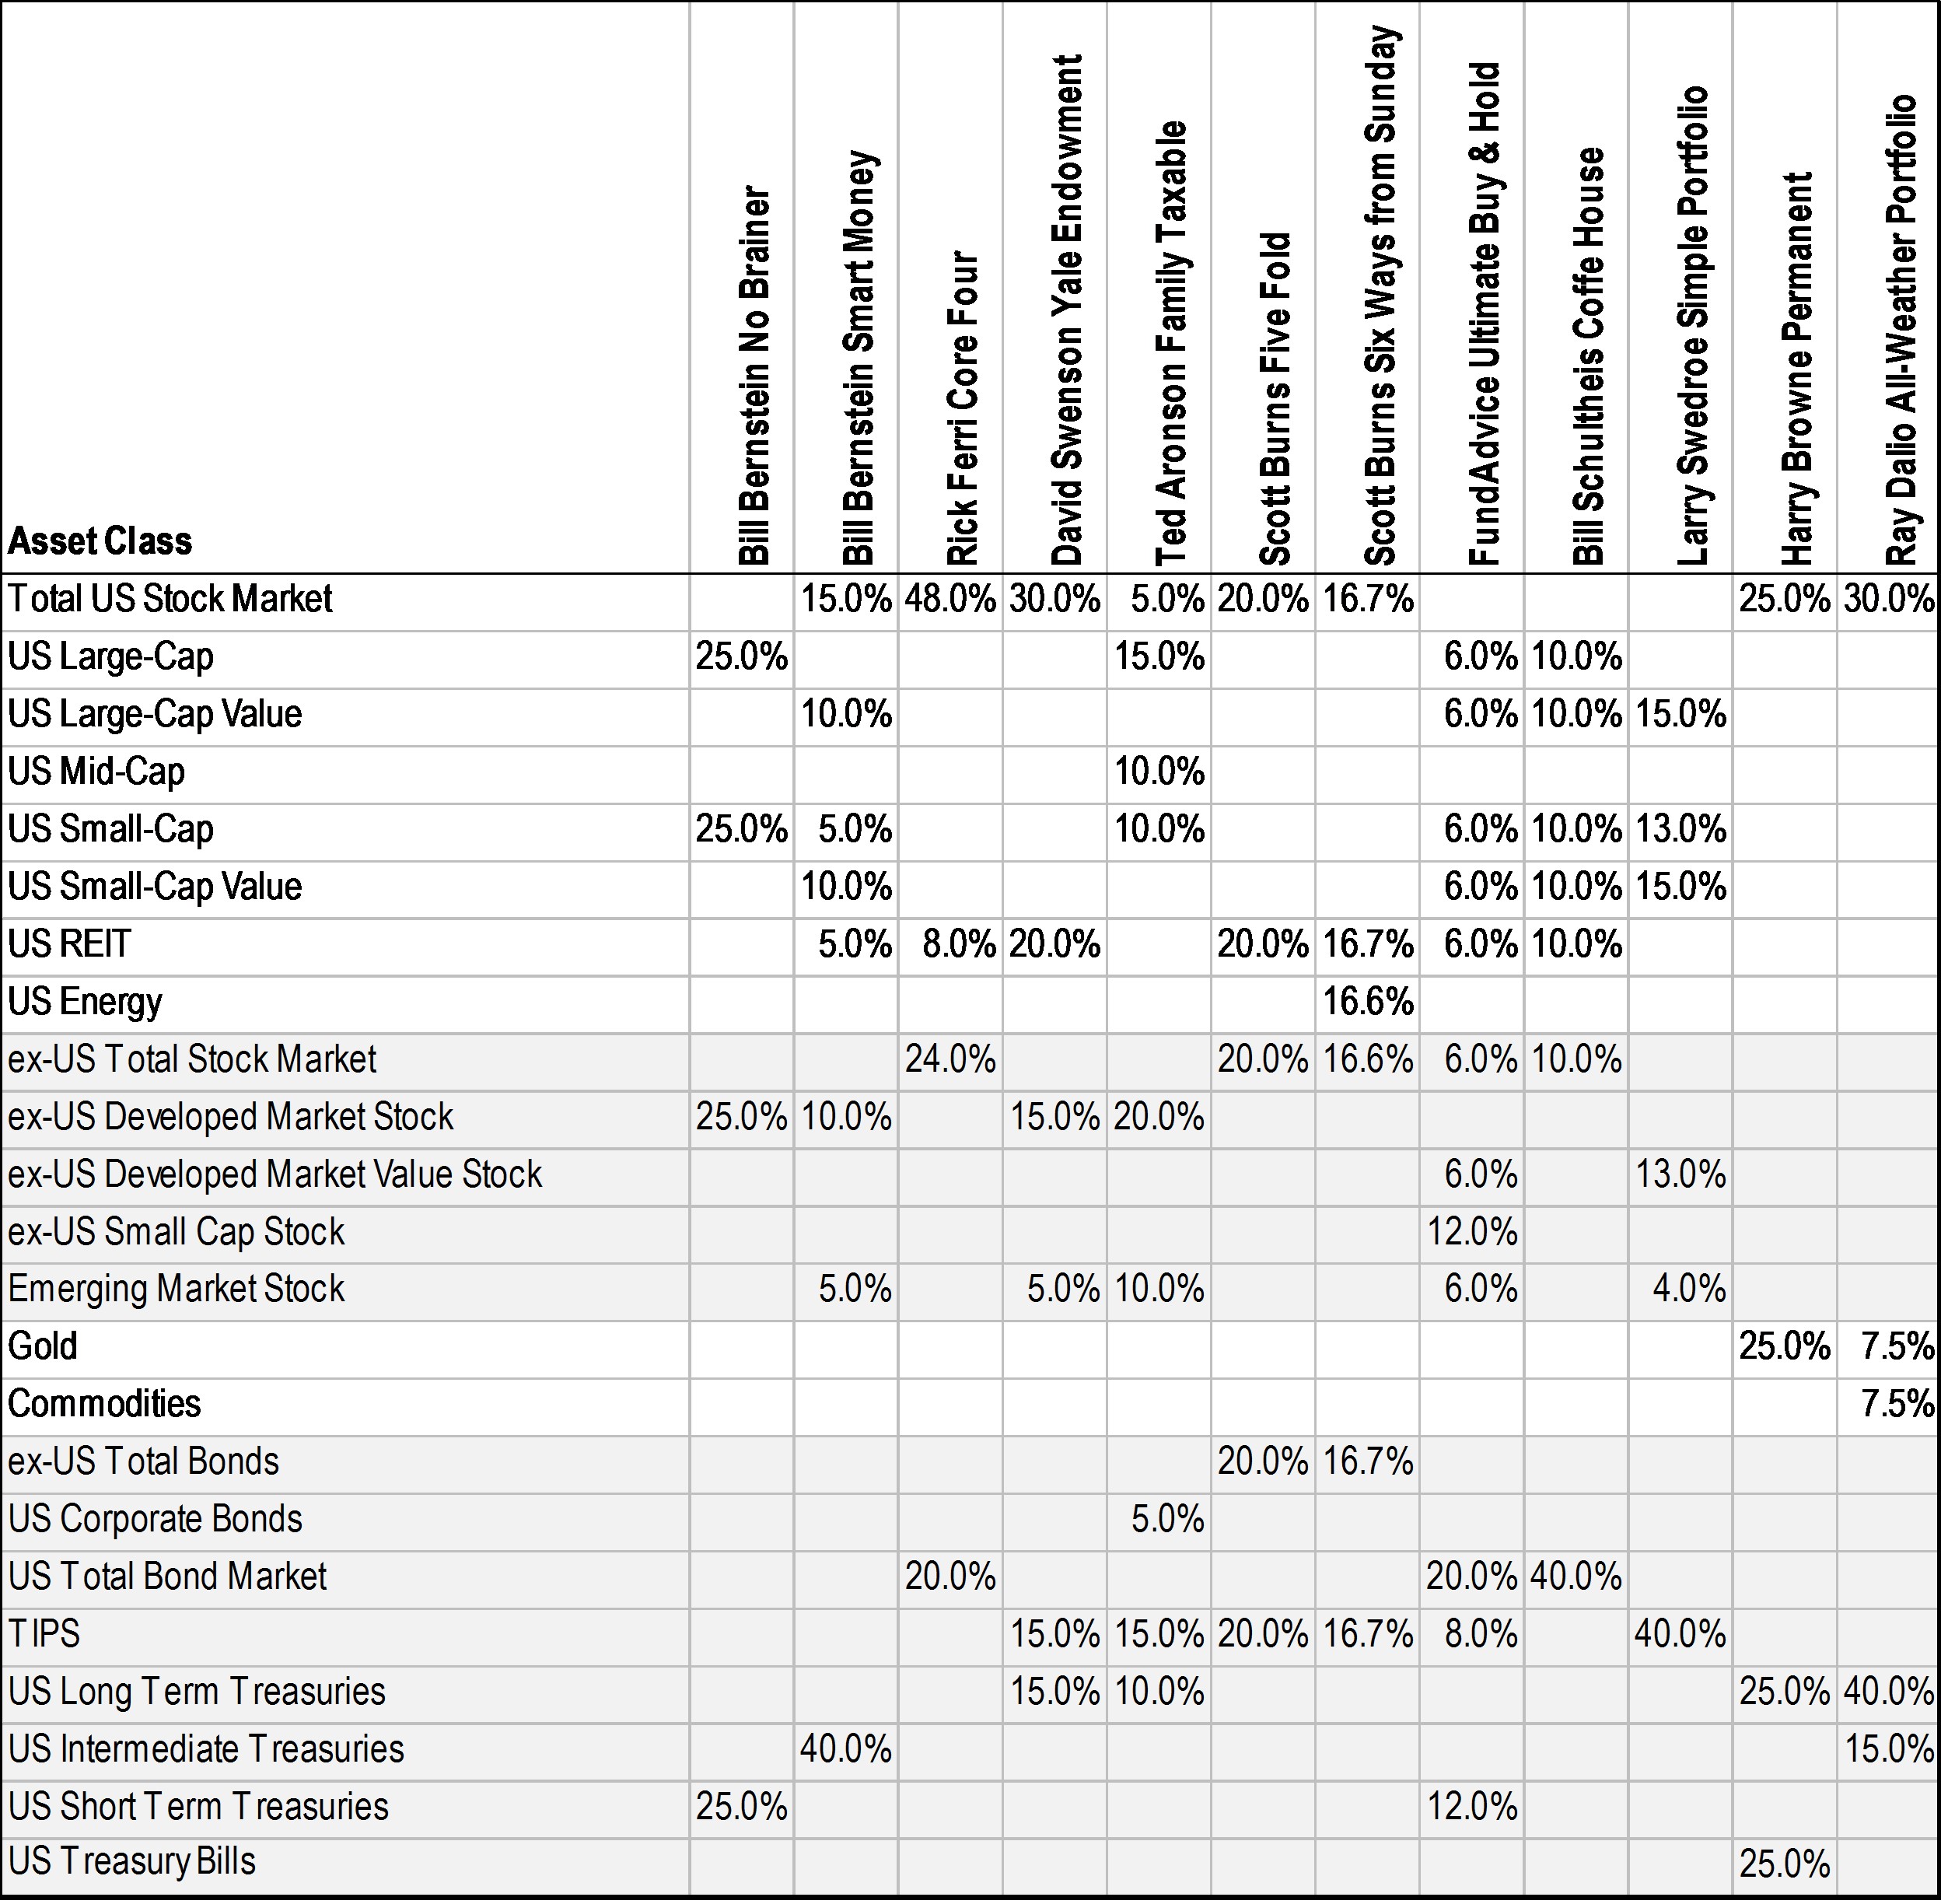
Below are “lazy” portfolios that are simple ones suggested by well-known financial advisers and investment professionals.
Portfolio Performance
How did ours stack up to theirs? Pretty good… In fairness to them, we optimized for all 8 of these metrics – they optimized for two metrics and tried to stay within the norm. All performance plots are for the time period 1972 through the end of 2016 and show after inflation returns. They all, including the other guys, require annual rebalancing. Without rebalancing, some of the efficiency is lost.
Average Annual Return vs Volatility of Annual Returns
The most frequently used metrics thanks to the work by Markowitz are average return and volatility of annual returns. In our opinions, these metrics don’t weight losses harshly enough and they penalize upside volatility – something that an investor typically doesn’t care about.

Annualized Return vs Downside Risk
When we look at annualized return… it starts to become apparent that other advisers don’t consider this metric in their portfolio construction. Our engineered portfolios grossly outperform.

Average 10 Year Return vs Volatility of 10 Year Returns
What the previous two plots don’t show is how consistent the performance is. We looked over a fairly long time period (1972 through 2016) whereas many investors will only have 10 to 20 years or so. So looking at the average 10 year return and volatility of 10 year returns shows how consistent the portfolios perform.
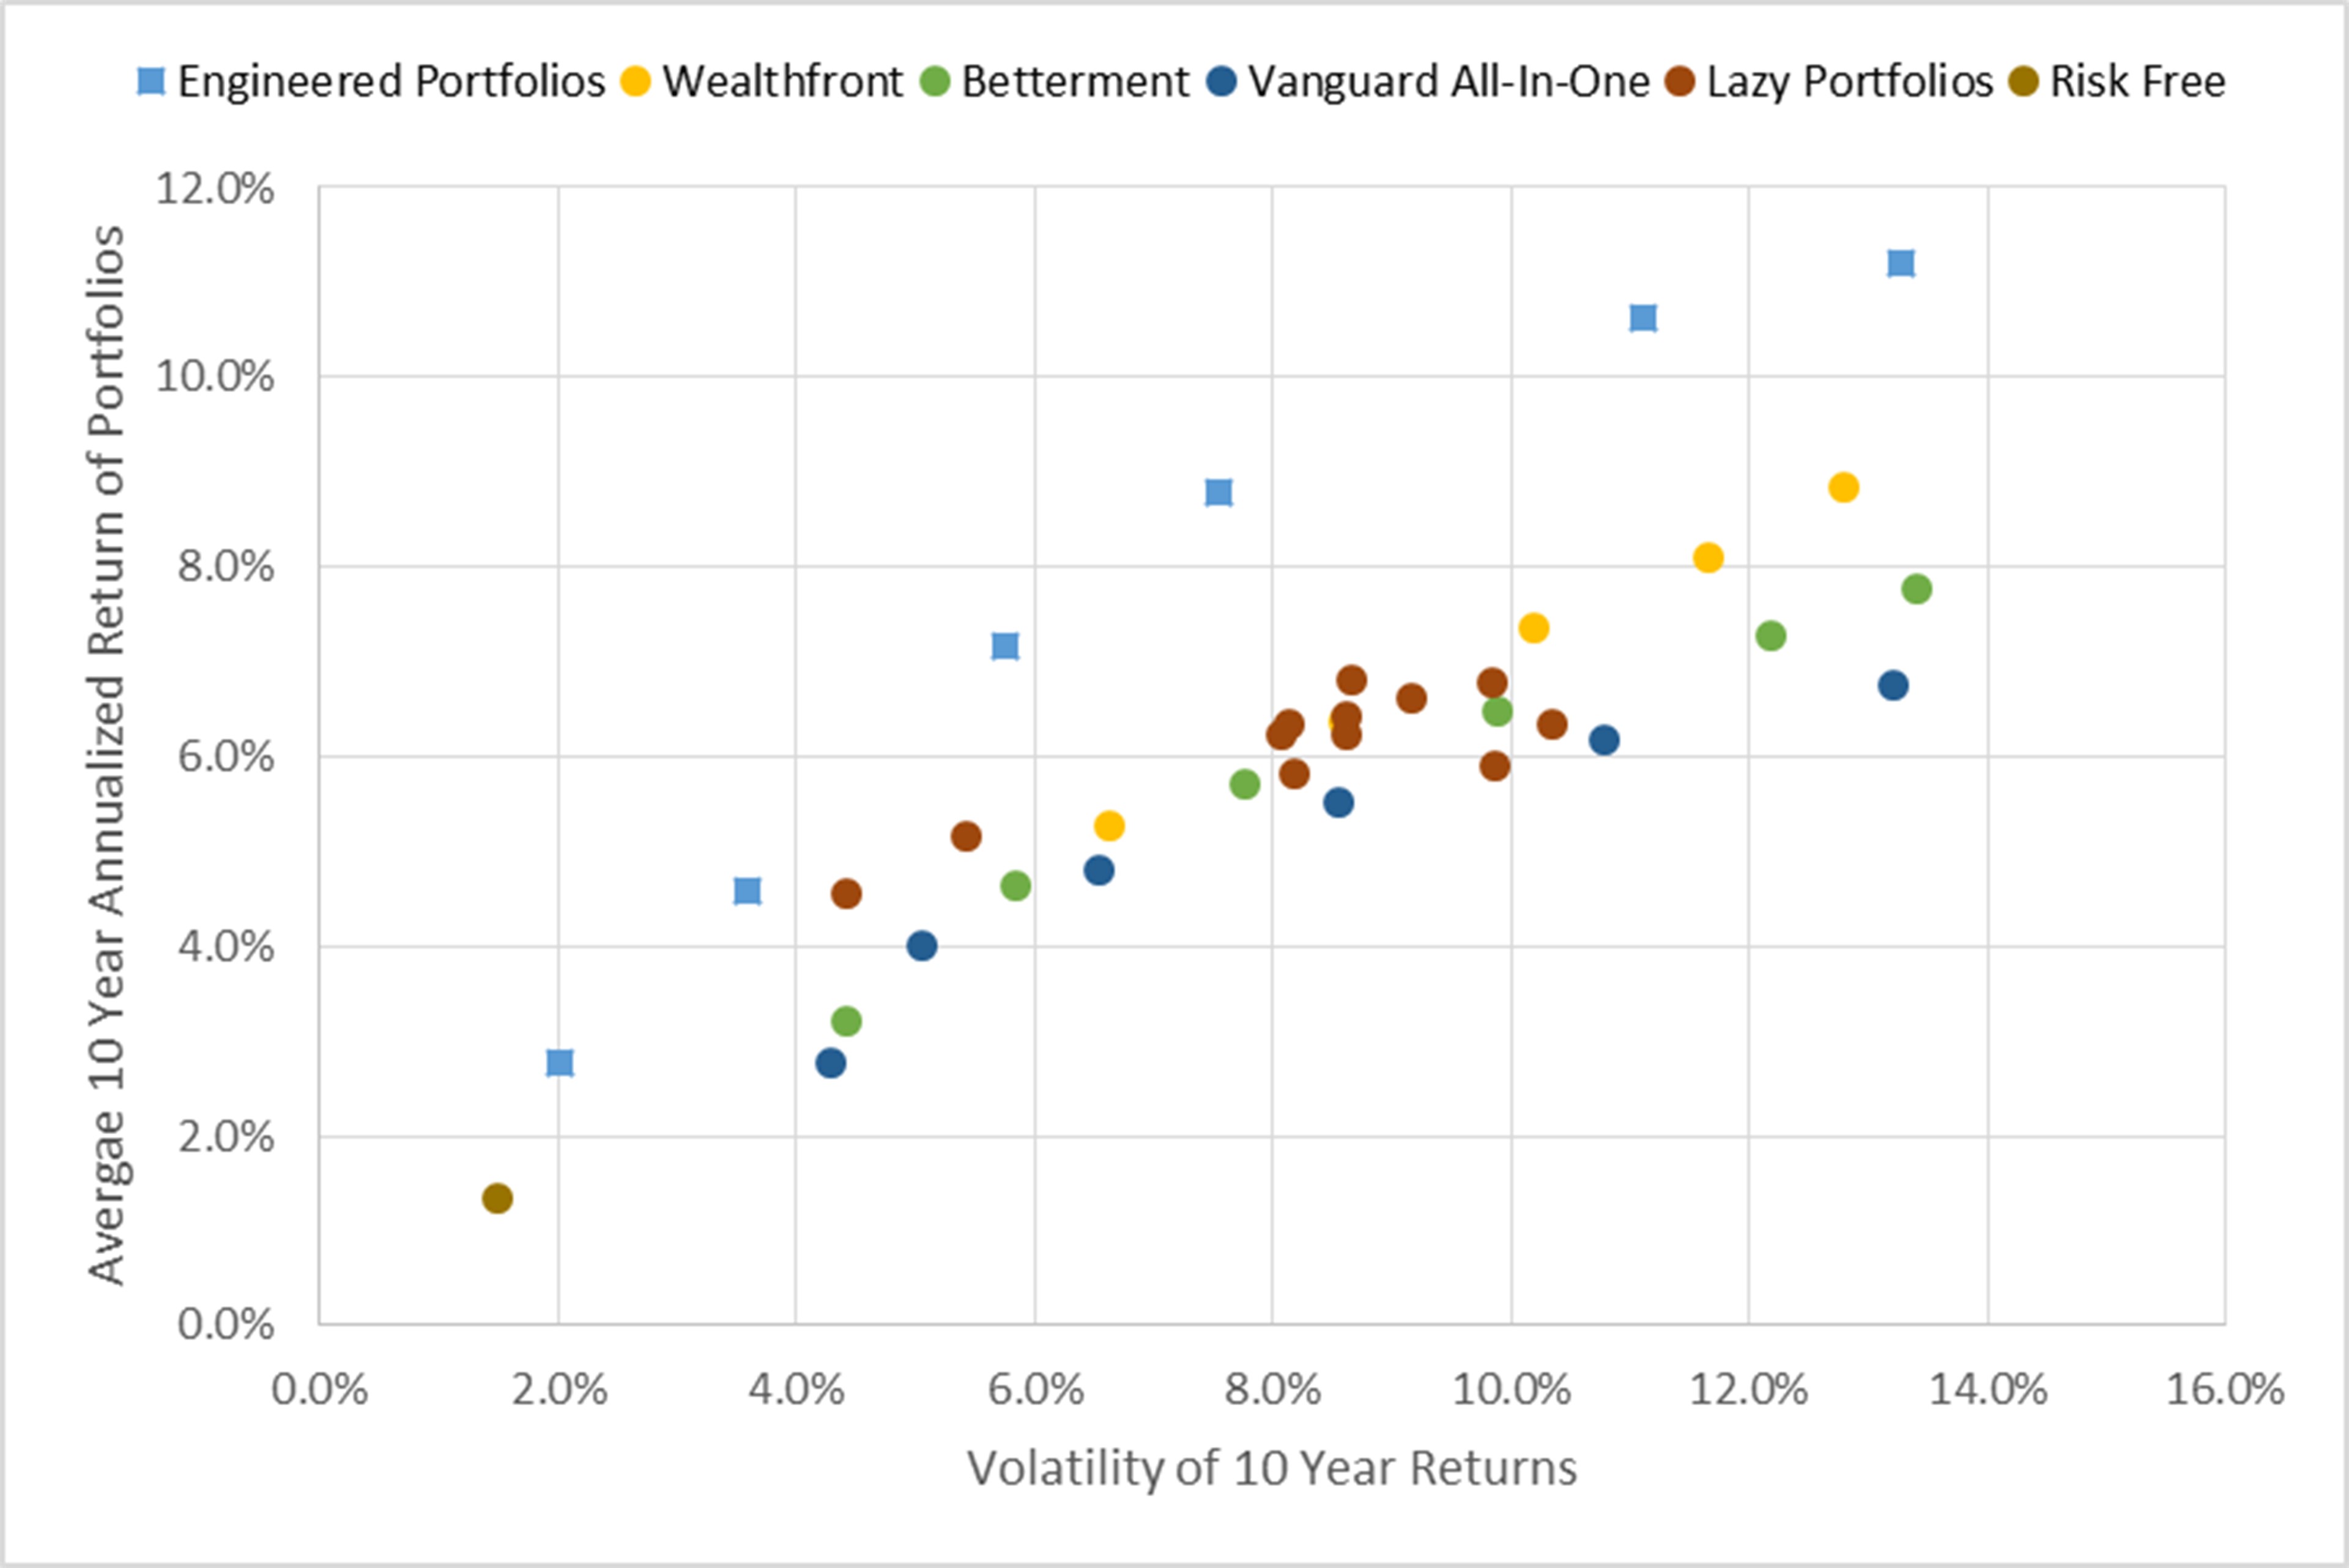
Note that the two “lazy portfolios” that appear to do okay here are the only two that contain gold: Harry Browne and Ray Dalio (he also has commodities).
Worst 15 Year Returns vs Largest Drawdown
How bad could/did it get? Plotting the worst 15 year return against the largest drawdown (peak to bottom) attempts to illustrate that.

Time Horizon
The next 6 plots compare the median trailing return against the 15th percentile return (very bad, but not the worst) for a given time period. This attempts to illustrate which portfolio you should consider for a given investment horizon – pick the one with best combination of median return and the bad case scenario returns. We got the idea to do this type of comparison from a Betterment research paper on stock allocation advice – it’s a very good read.
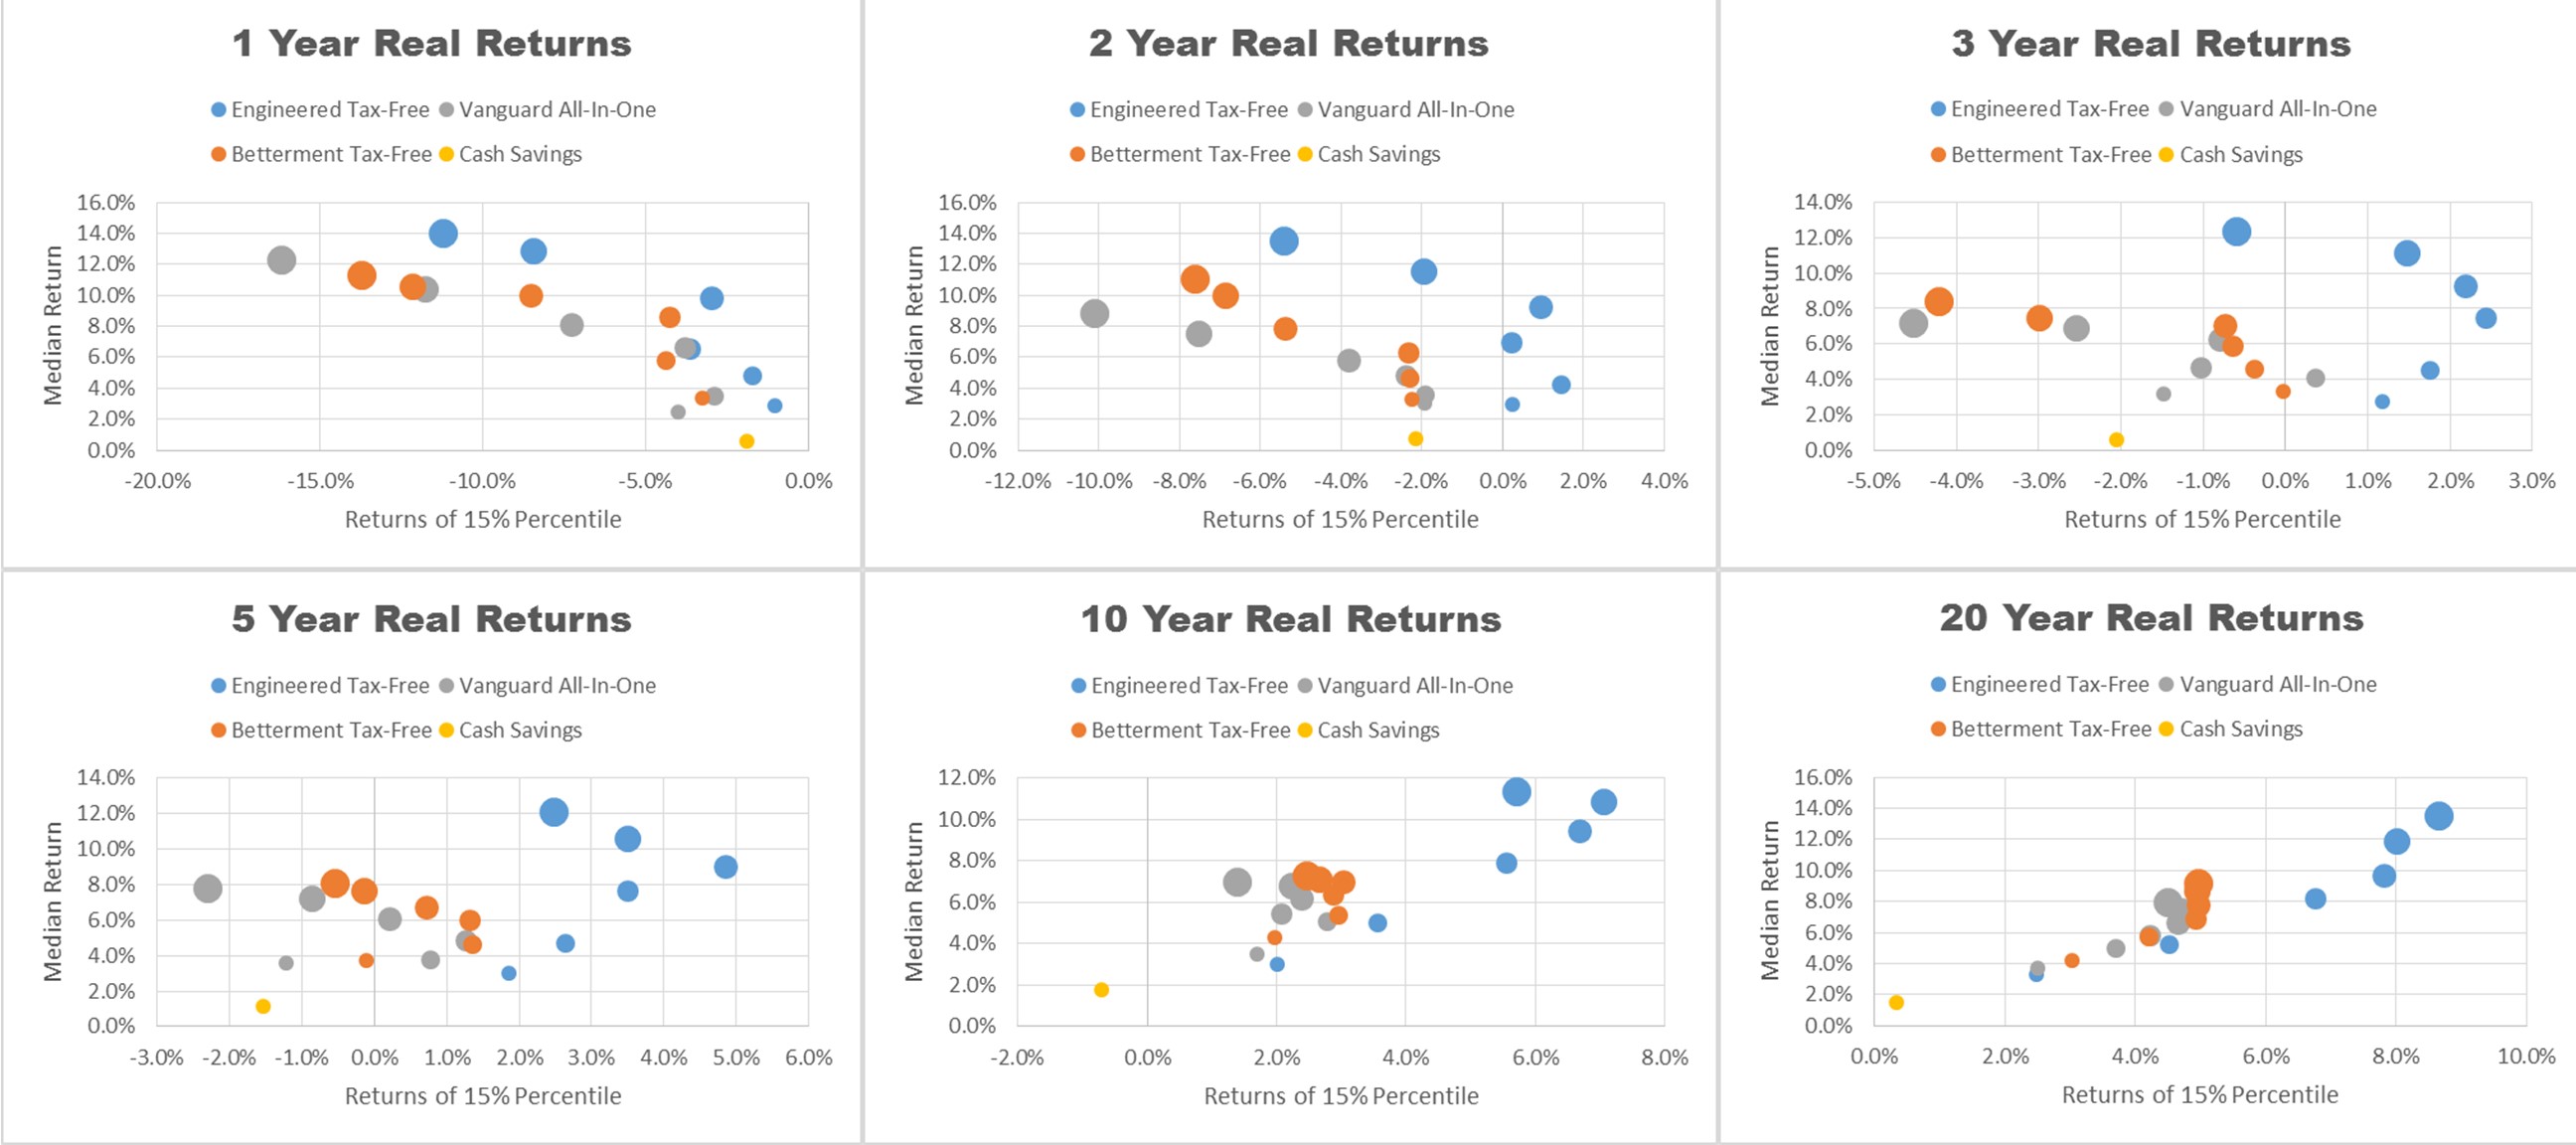
These plots clearly illustrate how efficient our portfolios are in all time periods. One should even notice that for a 1 year horizon… it would appear more risky to hold cash than to invest in our 1 year engineered portfolio (when taking into account inflation).
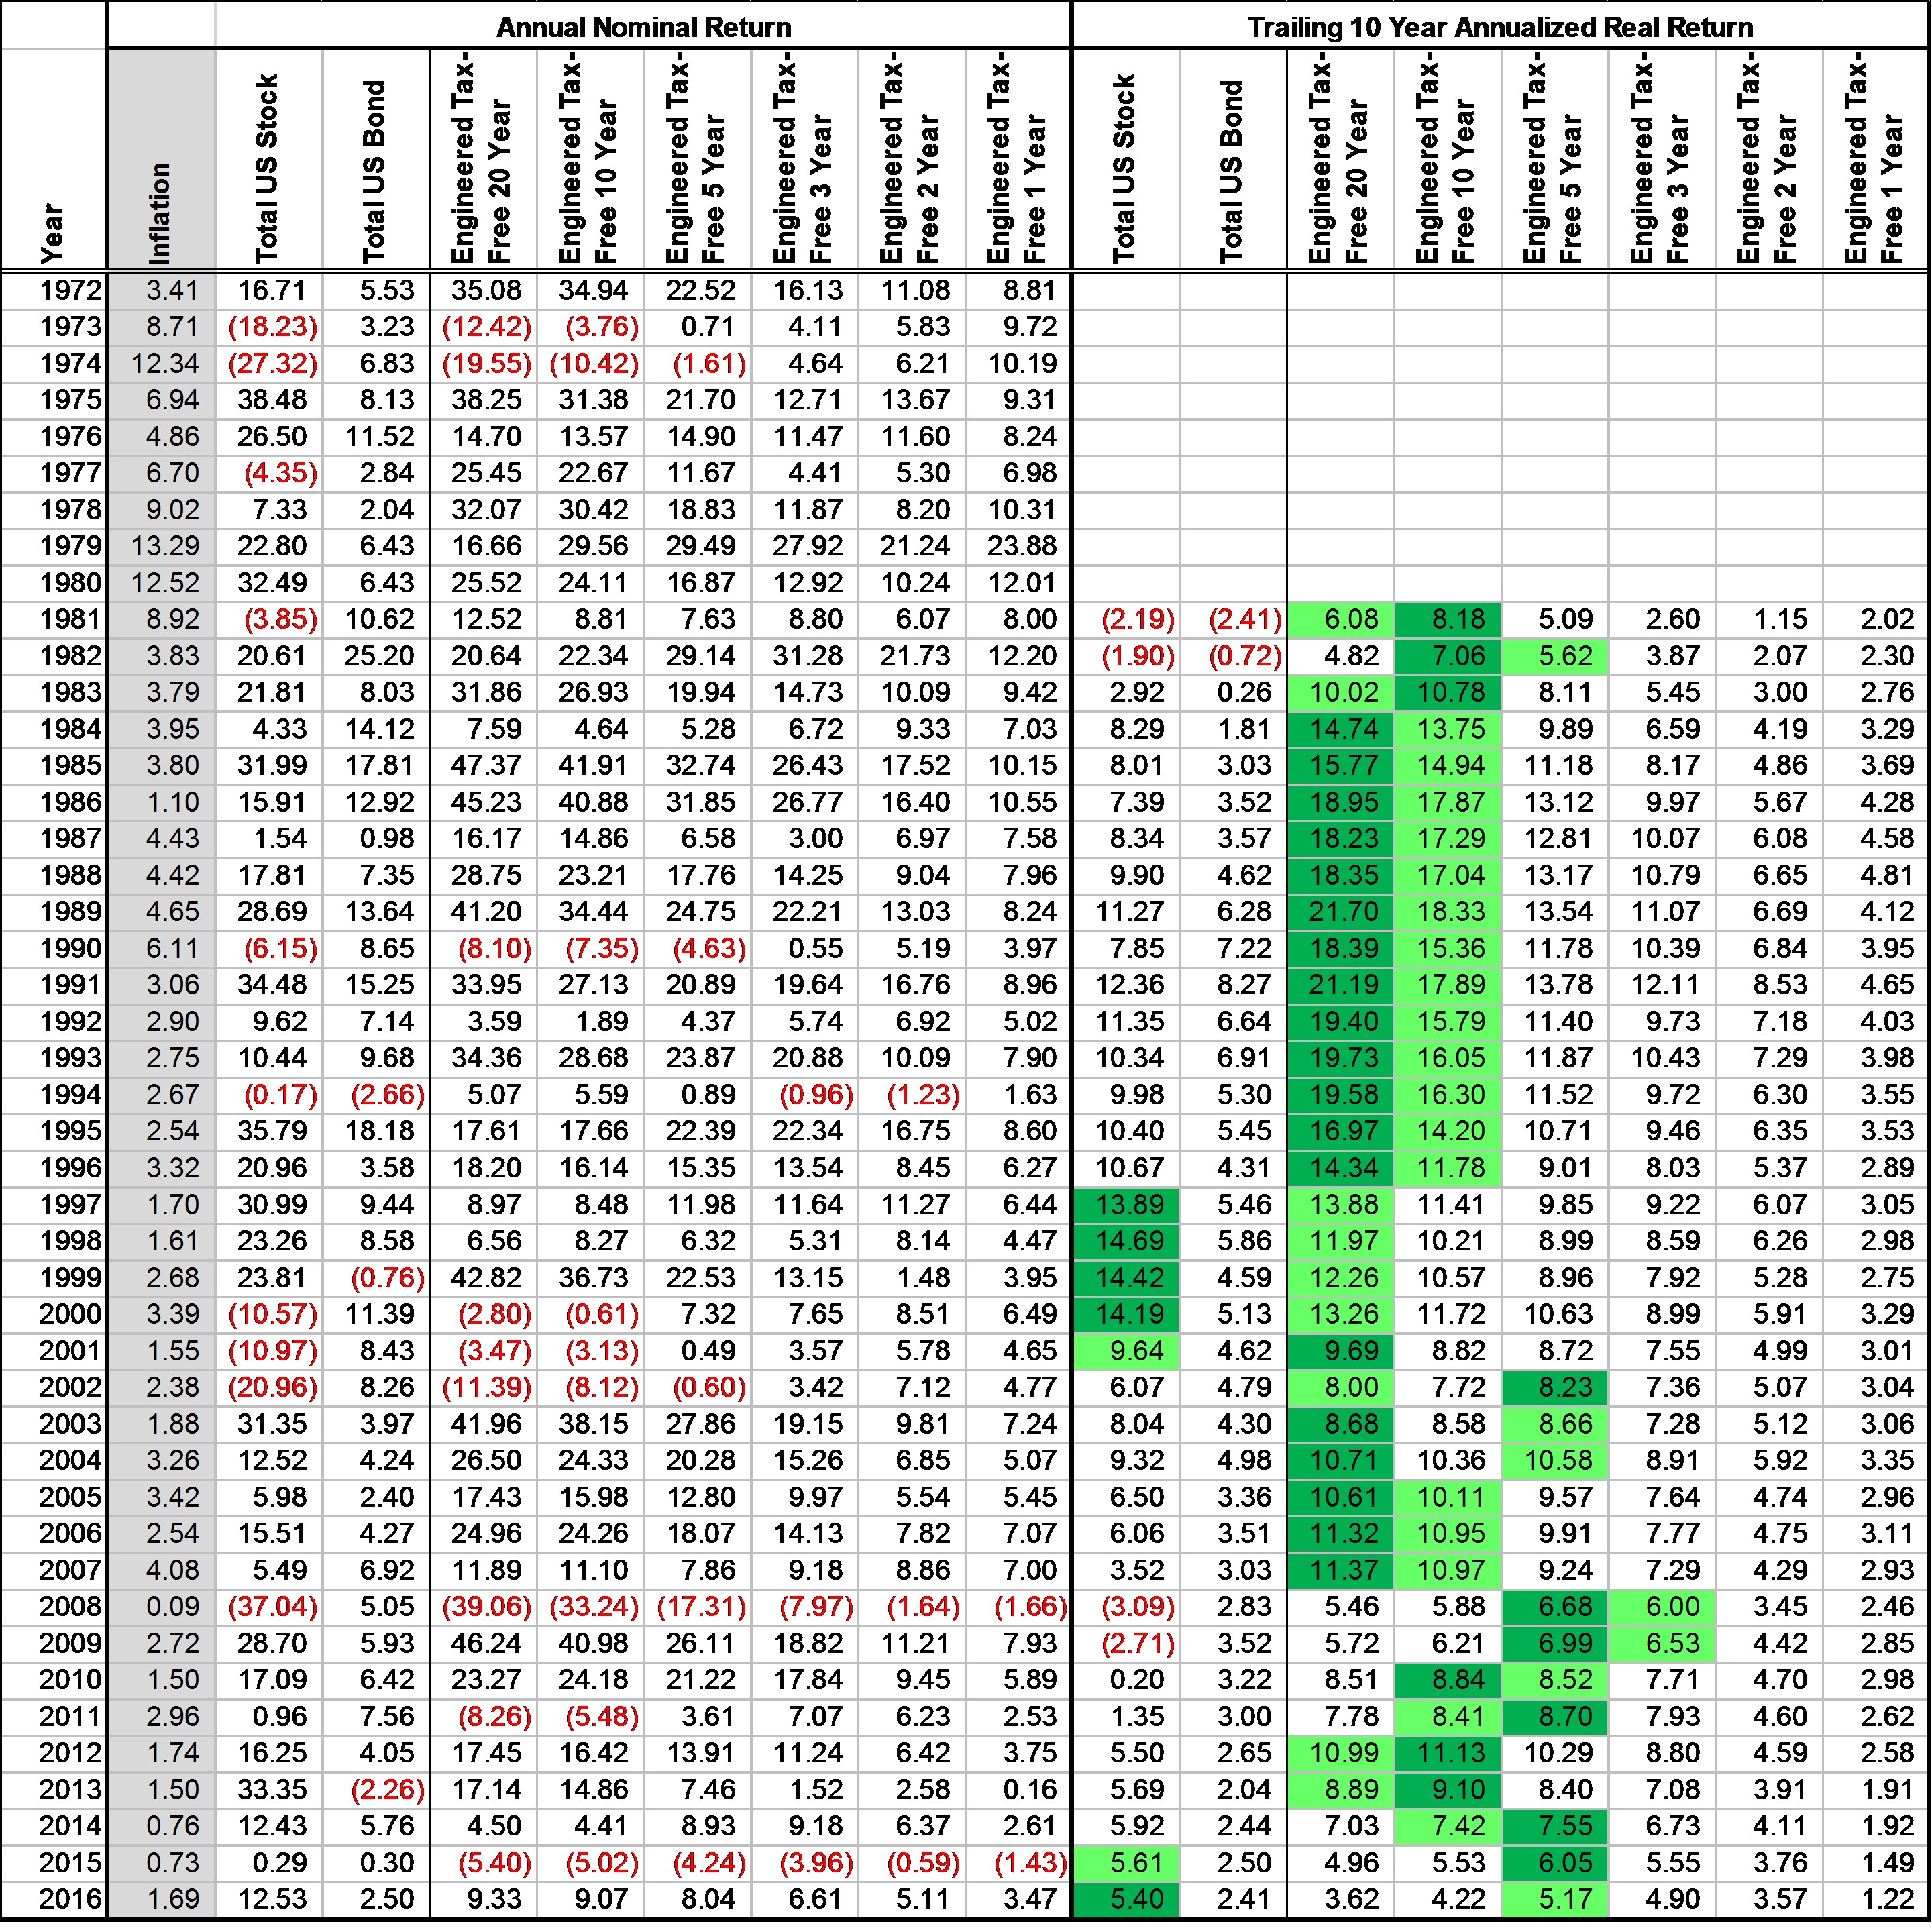
Returns-By-Year
More data is available to download. But below shows a table of the returns of our engineered portfolios compared to the US stock market and US total bond market for comparison.
How to Invest?
- Open a Robinhood account – for free
- Figured out your target portfolio and corresponding allocation to each asset class
- Buy ETFs that meet the target asset class, here are some suggestions:
- VOE: Mid-Cap Value
- VDC: Consumer Staples
- VSS: ex-US Small-Cap
- VWO: Emerging Markets Stocks
- EWD: Sweden Stocks
- EZA: South Africa Stocks
- IAU: Gold Trust
- VWOB: Emerging Markets Government Bonds
- BNDX: ex-US Bonds
- BND: Total US Bonds
- TIPS: Treasury Inflation Protected Securities
- VGLT: Long Term Government Bond
- VGSH: Short Term Government Bond
- SHV: Treasury Bills
- Begin emotionless investing in diversified and efficient engineered portfolios!
Do Your Own Analysis
I encourage you to download the data used in this analysis to draw your own conclusions too! Please don’t hesitate to reach out with any questions, comments, or concerns. We’re hopeful that we can help you get on the path to financial freedom through engineered investing!

Disclosures
The author(s) of this site have no formal financial investing training or certifications. The content on this site is provided as general information only and should not be taken as investment advice. All site content shall not be construed as a recommendation to buy or sell any security or financial instrument, or to participate in any particular trading or investment strategy. The ideas expressed on this site are solely the opinions of the author(s) and do not necessarily represent the opinions of sponsors or firms affiliated with the author(s). The author may or may not have a position in any company or advertiser referenced above. Any action that you take as a result of information, analysis, or advertisement on this site is ultimately your responsibility. Consult your investment adviser before making any investment decisions. This site/blog contains the current opinions of the author; the author’s opinions are subject to change without notice. This site is for informational purposes only and should not be considered as investment advice or a recommendation of any particular security, strategy or investment product. The charts and comments are only the author’s view of market activity and aren’t recommendations to buy or sell any security. Market sectors and related ETFs are selected based on his opinion as to their importance in providing the viewer a comprehensive summary of market conditions for the featured period. Chart annotations aren’t predictive of any future market action rather they only demonstrate the author’s opinion as to a range of possibilities going forward. All material presented herein is believed to be reliable but we cannot attest to its accuracy. The information contained herein (including historical prices or values) has been obtained from sources that Engineered Portfolio considers to be reliable; however, Engineered Portfolio makes no representation as to, or accepts any responsibility or liability for, the accuracy or completeness of the information contained herein or any decision made or action taken by you or any third party in reliance upon the data. Some results are derived using historical estimations from available data. Investment recommendations may change and readers are urged to check with tax advisors before making any investment decisions. Opinions expressed in these reports may change without prior notice. This memorandum is based on information available to the public. No representation is made that it is accurate or complete. This memorandum is not an offer to buy or sell or a solicitation of an offer to buy or sell the securities mentioned. The investments discussed on this site/blog may be unsuitable for investors depending on their specific investment objectives and financial position. Past performance is not necessarily a guide to future performance. The price or value of the investments to which this report relates, either directly or indirectly, may fall or rise against the interest of investors. All prices and yields contained in this report are subject to change without notice. This information is based on hypothetical assumptions and is intended for illustrative purposes only. PAST PERFORMANCE DOES NOT GUARANTEE FUTURE RESULTS.
