
For a portfolio compromised of mostly stocks and bonds, which asset provides the greatest diversification benefits?
In this post we’ll quantify the diversification benefits that gold, commodities, long term treasuries, and REITs provide to a portfolio of mostly stocks and bonds. Annual data will be reviewed going back to 1972 and daily data is also analyzed going back to mid-2006.
By the end of the post you’ll have a better idea of which alternative asset class to add to your portfolio to help reduce risk. As always, the data reviewed in this post is available to download.
Annual Returns
By Year Returns Data
First, let’s review the returns data of our 6 major asset classes (along with inflation for reference) going back to 1972. Right off the bat you’ll notice how consistently poorly both gold and commodities performs; but we’ll see that when paired with other assets and annually rebalanced, adding these to your portfolio can be beneficial. Another immediate interest is how the performance of commodities and gold seemed to flip in the last 30 years. In the first 30 years commodities offers much better returns to gold; but in the last 30 years, it’s been gold that has been better.

Also of note is how consistent US REITs have been. Even through the financial crisis, with a 20 year investment horizon, they have significantly beaten our other assets.
Performance Metrics
In the following table a number of different performance metrics are provided of our asset classes. In this table it becomes blatantly apparent at just how risky gold and commodities have been while also offering poor returns. Long term treasuries has also been significantly more risky than an aggregate US bond investment yet provided dis-proportionally higher returns (about twice as risky, only about 25% better returns). REITs have also clearly been an excellent investment historically relative to these alternatives.

Correlation Matrix
Clearly gold, commodities, and long term treasuries aren’t great investments on their own. But we’re not interested in investing in just one asset; we are trying to engineer an efficient asset allocation and so we must look at how these assets are correlated to one another.
A correlation of close to 1 means that the two assets move in unison. A correlation of 0 means that they tend to move completely independent of one another. And the holy grail is a correlation of less than 1 which indicates that they move out-of-phase with each other: when one goes up, the other goes down. And the correlation matrix suggests that even though gold and commodities have been poor investments on their own, their lack of correlation with both stocks and bonds may provide an opportunity.

Adding Each Diversifying Asset to Stocks and Bonds
In the next couple sections/plots we’ll compare the performance of portfolios that are compromised of 0-100% in increments of 10% of each asset class for total of 62 different possible portfolio combinations. The simple combination of just stocks and bonds will also be shown to (hopefully) help demonstrate how adding these assets can significantly improve efficiency. We’ll analyze 8 different metrics in 4 plots:
- Average annual real return
- Annualized real return
- Average 10 year real return
- Worst 15 year real return
- Standard deviation of annual returns
- Downside risk of annual returns (RMS of losses)
- Standard deviation of 10 year returns
- Largest drawdown
The returns all assume annual rebalancing – this is a must!
Long Term Treasuries
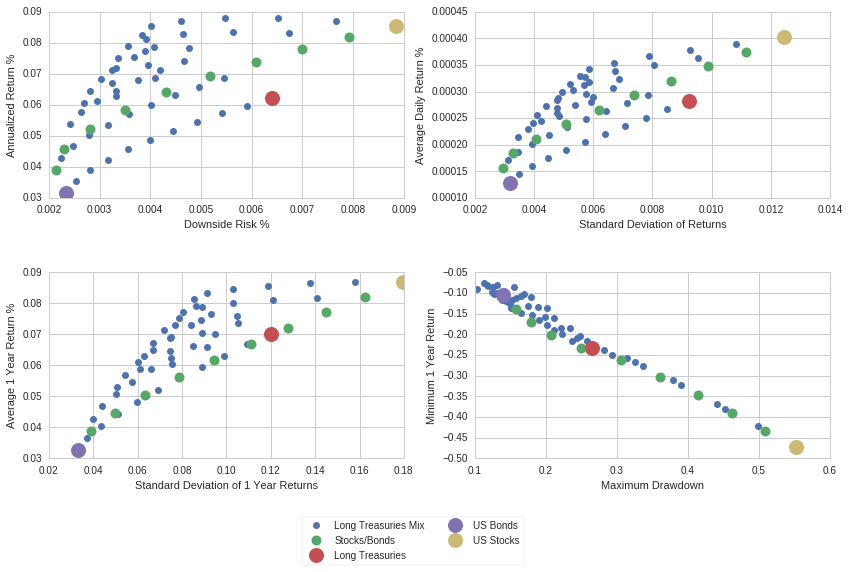
Adding long term treasuries provides a noticeable improvement to a portfolio of mostly stocks; but to a portfolio of mostly US aggregate bonds – adding treasuries seems to hurt. The conclusion here is that long term treasuries deserve a place in portfolios of high stock concentration; but should be avoided for safer portfolios.

REITs (Real Estate)
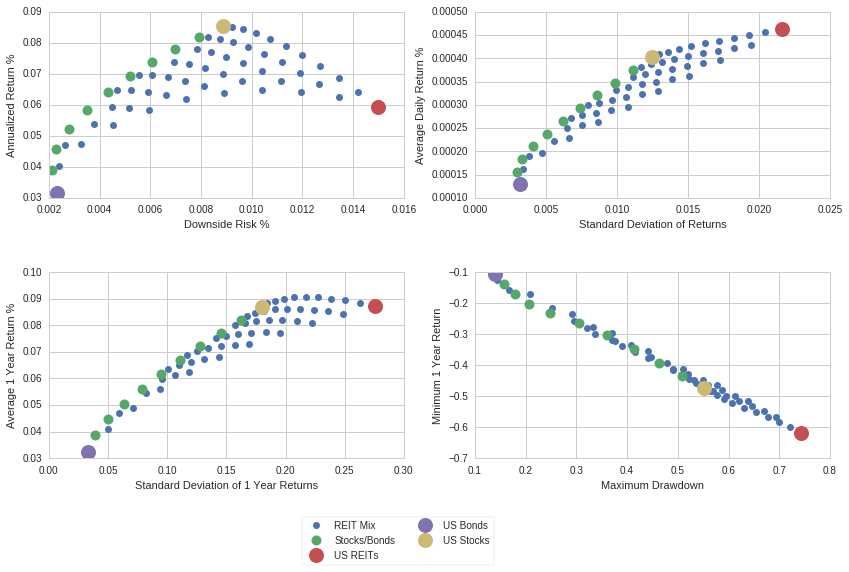
We know that real estate performed well on its own as an investment class; so it should be no surprise how adding it helps improve returns. But notice how significantly it improves the volatility of 10 year returns! And it also does wonders at maximizing the worst 15 year return. This suggests that for portfolios with a longer time horizon, REITs may deserve an allocation.

Commodities
Now things start to get interesting when we add an asset with a negative correlation: commodities. Even though commodities had offered abysmal investment performance, a small amount of it added to a portfolio of stocks and bonds can actually reduce risk while improving returns. What’s most noticeable is how impressive it helps minimize the drawdown! Remember, this is only made possible through rebalancing.

Gold
Now take a look at what adding gold does! This blew me away when I started seeing this phenomenon with gold in an investment portfolio. I hate the idea of investing in a yellow metal which can thank its returns only to the speculation of man. Yet!… it does wonders when added to portfolios of stocks and bonds.

Adding gold significantly helps all metrics. Most noticeable to me is how adding gold to a portfolio of stocks will actually increase the overall returns (rather dramatically) while significantly reducing risk. Over long time horizons gold also shines at reducing variation and minimizing losses. What’s also noteworthy is how adding gold helps even very conservative (bond heavy) portfolios!
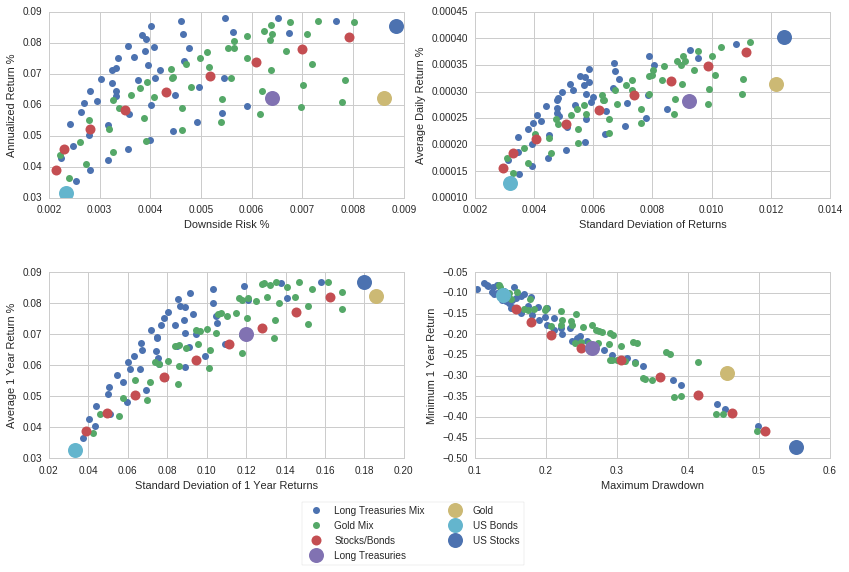
Gold the Winner Overall for Annual Returns
Now let’s plot them all against each other to see just how effective gold is. The light blue portfolio is a simple 40% stocks, 40% bonds, 20% gold.

Daily Returns
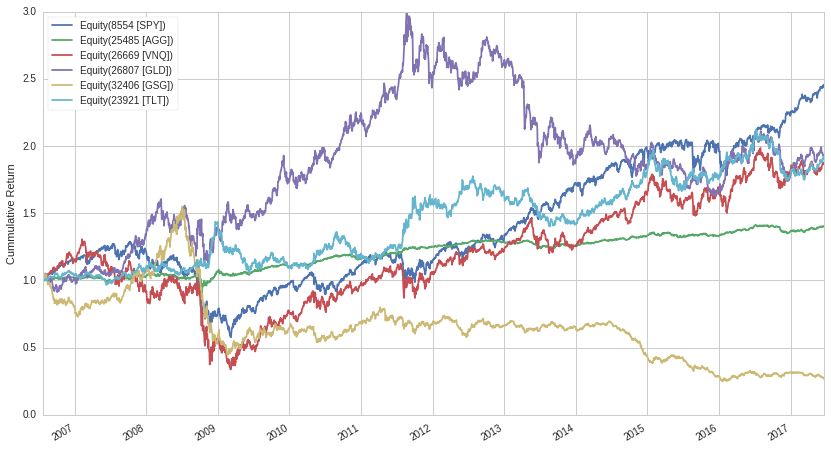
The previous data looked at annual returns over the last 40+ years. Have things changed in recent years? And does the daily data paint a different picture? In the next set of data we’ll use ETFs to see how things may have changed in recent times. Note that these results do not include dividends. We’ll look at the following ETFs:
- SPY – S&P 500 Trust
- AGG – iShares Aggregate Bond
- VNQ – Vanguard REIT
- TLT – iShares 20+ Year Treasuries
- GSG – iShares Commodities Trust
- GLD – Gold Trust
Here is the overall performance since mid-2006. Commodities have done very bad…
Daily Correlation
The daily correlations are a little different in recent times to the 40+ years of annual returns. Long term treasuries appears to be emerging as the new diversification king.

Adding Treasuries
In recent times adding treasuries has done a wonder on reducing risk and even increasing returns. Note that these results assume daily rebalancing though.
Adding REITs
REITs in recent years has provided no diversification benefit when looking at daily returns.
Adding Commodities
It should be of no surprise how poorly portfolios with commodities have performed of recent. Like REITs, they offered no diversification benefits over the last 10 years. For the contrarian… this could look like an opportunity though.

Adding Gold
Gold, who shined so drastically for the 40+ years of annual data still have provided meaningful diversification benefits on daily returns over the last 10 years. It has helped for both the heavy stock portfolios and heavy bond portfolios at reducing risk while improving returns.

Treasuries the Winner of Recent
Let’s compare the results with treasuries and with gold (we’ll ignore REITs and commodities to keep the plots clean). You’ll see that of recent, treasuries have provided the superior diversification benefit.
Conclusion
Gold deserves a place in virtually any investment portfolio (that does rebalancing) to reduce risk in the portfolio. It is counter intuitive; but it has historically offered the best diversification benefits. In recent years, treasuries have taken the lead in providing better benefits; but this may be short lived and could change as the FED starts selling their bond reserves. But we saw how treasuries do well as a diversifier to mostly stock portfolios on the 40+ years of data so you should consider it as a hedge for more aggressive portfolios.
I encourage you to download the data used in this analysis to draw your own conclusions too!

Disclosures
The author(s) of this site have no formal financial investing training or certifications. The content on this site is provided as general information only and should not be taken as investment advice. All site content shall not be construed as a recommendation to buy or sell any security or financial instrument, or to participate in any particular trading or investment strategy. The ideas expressed on this site are solely the opinions of the author(s) and do not necessarily represent the opinions of sponsors or firms affiliated with the author(s). The author may or may not have a position in any company or advertiser referenced above. Any action that you take as a result of information, analysis, or advertisement on this site is ultimately your responsibility. Consult your investment adviser before making any investment decisions. This site/blog contains the current opinions of the author; the author’s opinions are subject to change without notice. This site is for informational purposes only and should not be considered as investment advice or a recommendation of any particular security, strategy or investment product. The charts and comments are only the author’s view of market activity and aren’t recommendations to buy or sell any security. Market sectors and related ETFs are selected based on his opinion as to their importance in providing the viewer a comprehensive summary of market conditions for the featured period. Chart annotations aren’t predictive of any future market action rather they only demonstrate the author’s opinion as to a range of possibilities going forward. All material presented herein is believed to be reliable but we cannot attest to its accuracy. The information contained herein (including historical prices or values) has been obtained from sources that Engineered Portfolio considers to be reliable; however, Engineered Portfolio makes no representation as to, or accepts any responsibility or liability for, the accuracy or completeness of the information contained herein or any decision made or action taken by you or any third party in reliance upon the data. Some results are derived using historical estimations from available data. Investment recommendations may change and readers are urged to check with tax advisors before making any investment decisions. Opinions expressed in these reports may change without prior notice. This memorandum is based on information available to the public. No representation is made that it is accurate or complete. This memorandum is not an offer to buy or sell or a solicitation of an offer to buy or sell the securities mentioned. The investments discussed on this site/blog may be unsuitable for investors depending on their specific investment objectives and financial position. Past performance is not necessarily a guide to future performance. The price or value of the investments to which this report relates, either directly or indirectly, may fall or rise against the interest of investors. All prices and yields contained in this report are subject to change without notice. This information is based on hypothetical assumptions and is intended for illustrative purposes only. PAST PERFORMANCE DOES NOT GUARANTEE FUTURE RESULTS.

Leave a comment