recent posts
- Achieve Financial Freedom: The Importance of The Number
- Envision Your Financial Future and Plan How to Get There with a Portfolio of Portfolios
- This is Not Your Parents Diversification – Investment STRATEGY Diversification
- Get to Know your Small Business 401(k) Fiduciary…….and Save Millions
- Accelerating Dual Momentum Investing
author
Category: Historical Analysis
-

After my post on ex-US stock asset classes, I started to wonder if there are particular specific countries that have attractive stock market. Finding the historical returns of many different country stock markets would have been a tedious task; but thankfully the team at Credit Suisse does a summary of world equities every year in…
-

For a portfolio compromised of mostly stocks and bonds, which asset provides the greatest diversification benefits? In this post we’ll quantify the diversification benefits that gold, commodities, long term treasuries, and REITs provide to a portfolio of mostly stocks and bonds. Annual data will be reviewed going back to 1972 and daily data is also…
-

How efficient is the bond market? We’ve found inefficiencies within US sectors, size/style, and international stocks. Do similar inefficiencies exist in the bond market? One would belief that fixed income should be easier to accurately predict returns and thus the bond/fixed-income market should be relatively efficient. In this post we’ll put this assumption to the…
-
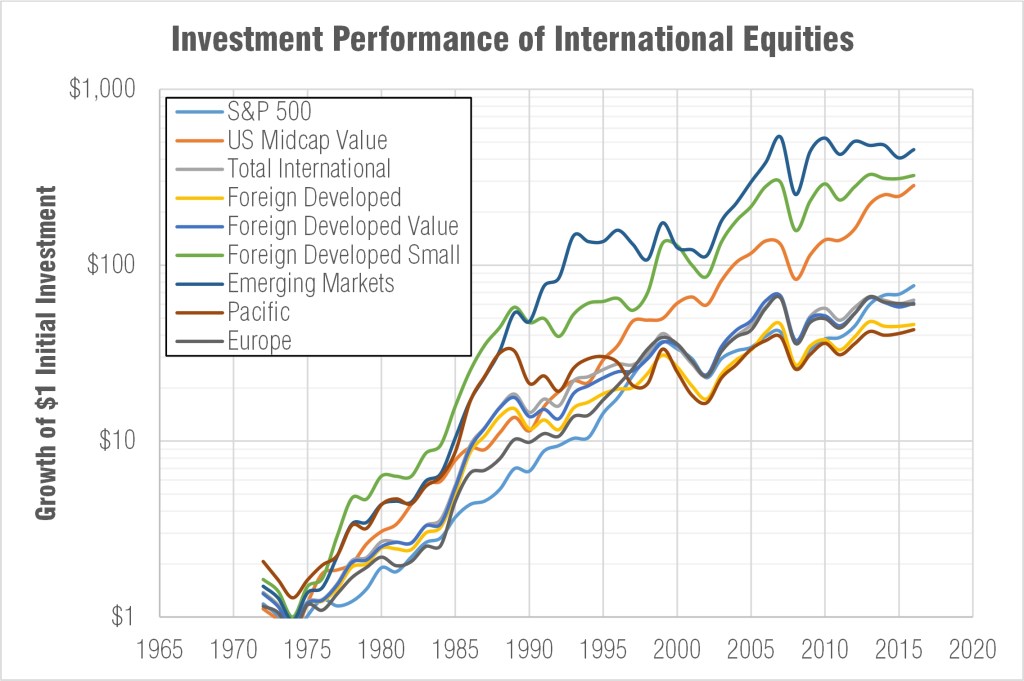
Are there any international equity asset classes that have historically offered better risk/reward characteristics? We found in US stocks that midcap value has been a very attractive investment in the long run, are there similar asset classes outside of the US? Turns out there are two: international (ex-US) small cap stocks, and emerging market stocks.…
-

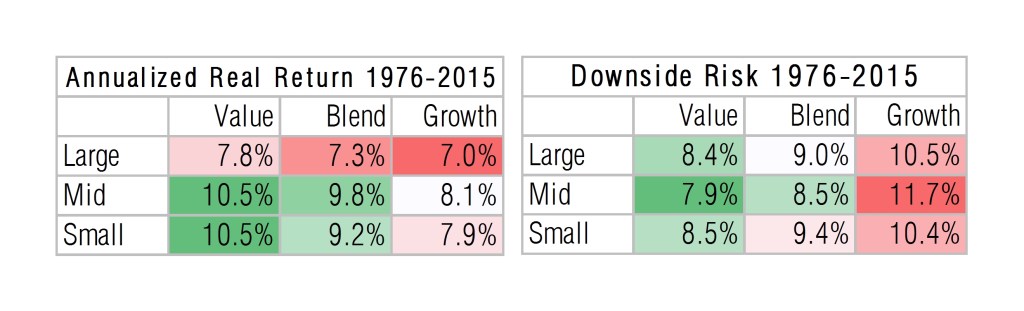
Everyone has heard of the investment adage to “buy low, and sell high.” But it’s very difficult to execute in practice. But the mid-cap value index buys low and sells high automatically for its investor. In this blog I’ll explain why this area of the equity market is so proficient. But I won’t stop at some simple…
-
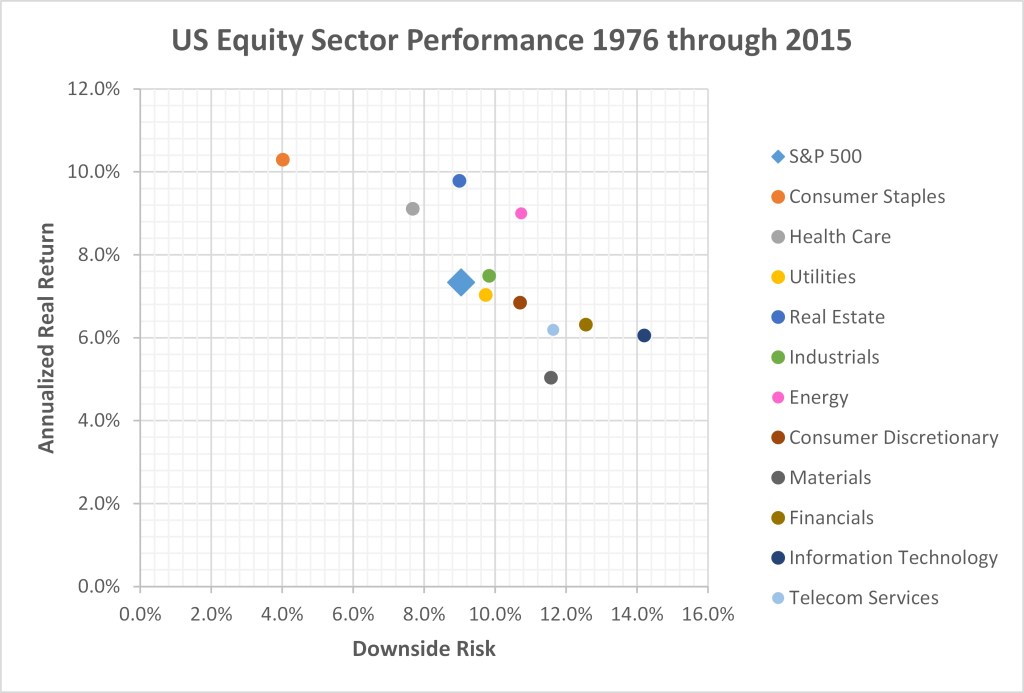
Should stock sectors be created equally? Are there some that consistently outperform and some that consistently underperform? After my post on the historical performance (and outperformance) of different US stock style boxes I set out to see if a similar phenomena occurs with US stock sectors. Surely the least risky sector won’t also offer the highest…
-
What area of the market offers the best risk-adjusted returns? Is there a better index to passively invest in and track than the S&P 500? I’ve always assumed there to be a risk/return relationship between market indexes; but when I began diving a little deeper into the historical data it quickly became apparent that there…
-

Stocks are risky but they generate high returns. Bonds are safer but they offer proportionally less returns. Investors may think that combining these asset classes in a portfolio linearly scales risk versus return. For the most part this is true; but due to a lack of correlation between these assets, combining them in a portfolio can actually…
