Are there any international equity asset classes that have historically offered better risk/reward characteristics? We found in US stocks that midcap value has been a very attractive investment in the long run, are there similar asset classes outside of the US?
Turns out there are two: international (ex-US) small cap stocks, and emerging market stocks.
In this post we’ll compare historical returns data from 1972 through the end of 2016 and highlight these two international stock asset classes that have grossly outperformed their peers. We’ll look at correlations between these asset classes and US stocks too to see if there are better or worse diversification opportunities.
As always, all data presented is available to download.
Historical Returns Data
Cumulative Returns
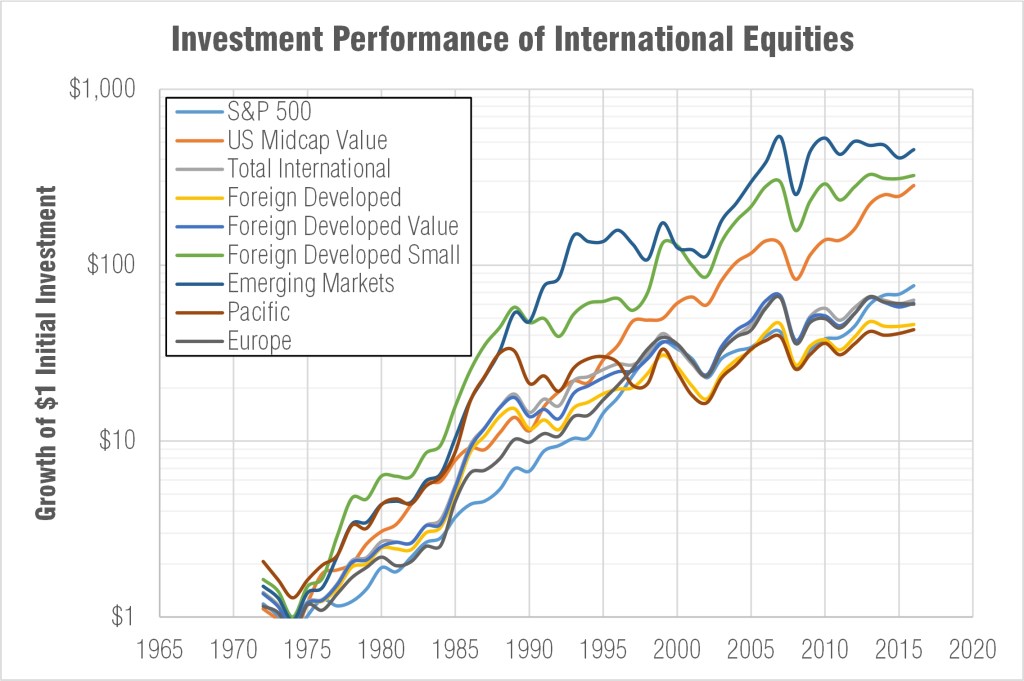
Let’s jump right in and plot the cumulative return in Figure 1 of 7 different international asset classes compared to the S&P 500 and US midcap value. Right away it becomes apparent that emerging market equity and international small caps grossly outperform their peers in the long run. That plot is logarithmic too; at the end of 40 years those asset classes have returned ten times more profit to their investors.

Annual Returns
Now let’s look at the returns by year and calculate/compare the trailing 10 year returns as done in Figure 2. I highlighted the worst performing international asset class dark red, the second worst in pink, the second best in light green, and the best in dark green. It should quickly become apparent to you that not only does international small caps and emerging markets outperform over the last 40 years… one of the two (often both) perform either first or second in every 10 year period. Only in the late 1990s did an asset class other than these two perform the best: European equities.

Performance Metrics
Let’s assess if this outperformance is achieved with more or less proportional risk.
Volatility vs Average Return
First in Figure 3 I’ve plotted the easiest thing to calculate (and the one average analysts default to) when quantifying risk/reward: average return against the volatility of those returns. In this plot the outpeformance is still obvious but it makes the markets look efficient (like they’re supposed to be) – small cap international and emerging markets are requiring a proportional amount more volatility to achieve those returns.

Annualized Returns vs Downside Risk
Investors don’t care about volatility though. I’m not upset when an asset class jumps up 50%+ which emerging markets and small cap international are known to do. I do care when it drops a lot and often. Therefore we’ll use downside risk as our risk metric which takes the root mean square of annual losses. Years that it had a gain are set to 0 in this calculation to effectively weight the frequency of losses. Here’s some more information on downside risk and Sortino ratio.
Investors also don’t care about average returns. I want to know how much it returns in the long run so I need the annualized return data. Averages don’t give you the real picture. For example, let’s look at an asset class that returns 50% one year, and -50% the next year. Someone who just calculates the average return will calculate 0. But an investor didn’t feel an average return of 0. They may have started with $10,000; after a year they were at $15,000. But then a 50% loss comes in wipes him down to $7,500 – that’s not an average loss of 0% its an average loss of 13%!
In Figure 4 we see that when looking at annualized return vs downside risk, the case for international small caps and emerging markets becomes stronger. They still carry more risk than developed markets and larger stocks; but the outperformance comes with a lower proportional increase in risk. You may notice that mid cap value is crushing it on the top left of the plot (less risk, more return) – yeah mid cap value is awesome.

Summary Metrics
Figure 5 provides a summary table of a number of performance metrics of international stock asset classes. US inflation and the returns of treasury bills (used as the “risk-free” investment for Sharpe & Sortino ratios) are included for comparison along with the S&P 500 and mid cap value. The Sharpe and Sortino ratios (attempts to define the risk adjusted returns) are both significantly higher for internal small caps and emerging markets.

Correlations
Figure 6 shows the correlation in annual returns between these asset classes. The less correlated the better diversification opportunity an investor has by adding these to his/her portfolio. International small cap and emerging markets are about 25% less correlated to the S&P 500 compared to larger stocks in developed markets. This makes sense, big companies are global behemoths – a large US company is going to have similar global exposure as a large European company for example. Smaller stocks or companies in emerging markets will be more reliant on their smaller/domestic markets which offer a US investor much better diversification.
Notice also how even less correlated US mid value is to emerging markets and international small… more on that later.
International small cap and emerging markets are relatively correlated so one could make the argument that you only need one of the two if you’re trying to keep your portfolio simple.

Conclusions from the Data
Emerging Markets and International Small Grossly Outperform
I see this data and conclude that there is no reason to own large developed foreign stocks. In my investment accounts I only have small cap and emerging market exposure for my international allocations (and small tilts to South Africa and Sweden – discussed in another post).
Value Premium Internationally
The value premium in the US is significant, especially with smaller stocks. Foreign value stocks outperform blend or growth; but the outperformance isn’t as striking. This data doesn’t include international small value though – maybe here the value premium is exaggerated like it is in the US.
Geography Matters
Notice the difference in performance of pacific stocks to European. Now Japan has had a terrible run at it over the last several decades with deflation; but this should highlight that where you invest matters. Buying an ex-US fund will offer diversification; but it may force you to buy into countries or regions that aren’t worthwhile investing in. I dove a bit deeper into country-specific stock market performance in another post based off data from Credit Suisse.
Anyone Else Notice This?
We here at engineered portfolio aren’t the only ones to notice the discrepancy in performance of international equities. Here are a couple resources from other institutions:
- MSCI: Revisiting Global Small Caps
- WSJ: The Case for Buying Small-Cap Foreign Stocks
- Bloomberg: History Shows Best Equity Gains Come From Emerging Markets
Vanguard of course has an article warning against the allure of emerging markets which is worth a read. They believe in an efficient market and I tend to agree with them. But we’ve found the market is not completely efficient. There are opportunities if you dig a bit (deeper than the average investor) and have a steadfast investing strategy.
Where to Invest
There are a couple ETFs that you check out as possible investment vehicles to gain exposure to these asset classes:
- SCZ: iShares MSCI EAFE Small-Cap ETF – 0.40% expense ratio
- IEMG: iShares Core MSCI Emerging Markets ETF – 0.14% expense ratio
- VSS: Vanguard FTSE All-World ex-US Small-Cap ETF – 0.13% expense ratio
- VWO: Vanguard FTSE Emerging Markets ETF – 0.14% expense ratio
What about Now?
History looks great; but will this trend continue? I don’t know what will happen in the future nor do I speculate what will happen. But the past has shown us small caps internationally and emerging markets have outperformed international developed markets. And so that’s where I’ll put my money. And in this exact moment in time… it may be an opportune time to increase your international exposure as the beaten international stocks seem to be picking up the pace and running ahead much faster than domestic stocks.

Keep in Touch
We’ll continue this type of analysis with other asset classes, so subscribe to the blog if interested. Also don’t hesitate to reach out with any questions! And the data is available to download in a spreadsheet so that you can do your own analysis.

Disclosures
The author(s) of this site have no formal financial investing training or certifications. The content on this site is provided as general information only and should not be taken as investment advice. All site content shall not be construed as a recommendation to buy or sell any security or financial instrument, or to participate in any particular trading or investment strategy. The ideas expressed on this site are solely the opinions of the author(s) and do not necessarily represent the opinions of sponsors or firms affiliated with the author(s). The author may or may not have a position in any company or advertiser referenced above. Any action that you take as a result of information, analysis, or advertisement on this site is ultimately your responsibility. Consult your investment adviser before making any investment decisions. This site/blog contains the current opinions of the author; the author’s opinions are subject to change without notice. This site is for informational purposes only and should not be considered as investment advice or a recommendation of any particular security, strategy or investment product. The charts and comments are only the author’s view of market activity and aren’t recommendations to buy or sell any security. Market sectors and related ETFs are selected based on his opinion as to their importance in providing the viewer a comprehensive summary of market conditions for the featured period. Chart annotations aren’t predictive of any future market action rather they only demonstrate the author’s opinion as to a range of possibilities going forward. All material presented herein is believed to be reliable but we cannot attest to its accuracy. The information contained herein (including historical prices or values) has been obtained from sources that Engineered Portfolio considers to be reliable; however, Engineered Portfolio makes no representation as to, or accepts any responsibility or liability for, the accuracy or completeness of the information contained herein or any decision made or action taken by you or any third party in reliance upon the data. Some results are derived using historical estimations from available data. Investment recommendations may change and readers are urged to check with tax advisors before making any investment decisions. Opinions expressed in these reports may change without prior notice. This memorandum is based on information available to the public. No representation is made that it is accurate or complete. This memorandum is not an offer to buy or sell or a solicitation of an offer to buy or sell the securities mentioned. The investments discussed on this site/blog may be unsuitable for investors depending on their specific investment objectives and financial position. Past performance is not necessarily a guide to future performance. The price or value of the investments to which this report relates, either directly or indirectly, may fall or rise against the interest of investors. All prices and yields contained in this report are subject to change without notice. This information is based on hypothetical assumptions and is intended for illustrative purposes only. PAST PERFORMANCE DOES NOT GUARANTEE FUTURE RESULTS.

Leave a comment