What area of the market offers the best risk-adjusted returns? Is there a better index to passively invest in and track than the S&P 500?
I’ve always assumed there to be a risk/return relationship between market indexes; but when I began diving a little deeper into the historical data it quickly became apparent that there are certain areas of the market that defy logic and offer higher returns with less risk.
Returns
Let’s first take a look at company size versus return and risk. It shouldn’t be any surprise that small cap stocks ($10 billion in market cap, represent about 70% of total market); but they require the investor to take on more risk to achieve that additional return. But what about the middle? Mid-cap stocks (between $2B and $10B, represents about 20% of total stock market) have historically offered more returns than large-cap stocks (no surprise); but their returns are also larger than small cap stocks! What’s even stranger is that this higher return does not come with more risk, it comes with less!
Taking a look at style (value versus growth), the value premium is exaggerated for mid-cap and small-cap stocks. It’s relatively well documented that value companies, stocks that have lower valuations compared to their peers, have outperformed growth stocks. In large-caps this outperformance is less than 1%, still enough though that you’ll see a lot of investment portfolios tilt to value. But in mid and small cap stocks, the value premium is over 2%! The best performing area of the US market was tied between mid-cap value and small-cap value for the time period of 1976 through the end of 2015. And they outperformed by a lot!
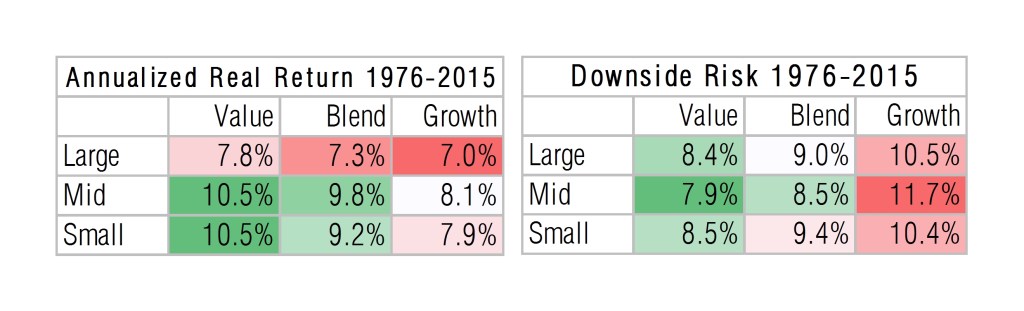
Below I’ve constructed a table that looks at the annualized (I hate when investment firms publish the average return not annualized) real (I also hate it when they don’t take into account inflation) returns of different style boxes from the beginning of 1976 to the end of 2015. Look at how much higher the returns are for mid and small-cap value stocks!

Risk Defined by Volatility
Now let’s look at the risk the investor had to take on to earn these returns. Let’s first use the risk metric that everyone uses, volatility or the standard deviation of annual returns. The lower the volatility is, the lower the perceived risk is of that investment.

Volatility illustrates the more traditional and accepted notion that value stocks can and are less risky than growth. This is the table that most advisers and managers will refer to when recommending a value tilt, specifically a large-cap value tilt. But we can’t ignore mid and small cap value, especially when looking at a more appropriate risk metric like downside risk and overall performance.
Downside Risk
Now let’s use downside risk instead of volatility. Downside risk was developed by Dr. Frank Sortino in the 1980s. He recognized that using volatility to measure risk doesn’t tell the full story. An investor cares about how often they lost money and how severe were those losses. An investor doesn’t care about volatile years that are generating high returns.
For example, let’s compare stock A’s returns of 60%, -10%, and 40% in a three year period to stock B that had -10%, 10%, and -10% in that same three year period. Volatility will paint stock B as “safer” because its standard deviation of returns is equal to 9.4% compared to stock A’s 29.4%. But an investor would look at these two sets of returns and clearly prefer stock A because he/she lost less often. Downside risk takes the root mean square (RMS) of the losses, setting years it won to 0. This weights not only the severity of your losses but also the frequency. And downside risk of these two stocks correctly tells us that stock A is less risky with a 5.8% downside risk compared to stock B’s 8.2%. Here’s a very nice article on the math behind downside risk and the Sortino ratio.
So if we look at the downside risk of the sector box (I used treasury bills as the “risk-free” rate of return for calculating downside risk), value stocks show their strength. But surprisingly we find that mid-cap value is actually the least risky area of the market, followed by large-cap value and very closely after that is small-cap value.

I look at these two style boxes and conclude that the only logical decision is to invest solely in mid-cap value and small cap value stocks.
Style Box Returns by Year
Lastly, let’s look at the annual returns by year for this period (I’m an engineer, I hate when people don’t share their data). The right side of the table shows the trailing 3 year annualized return to help clean up the comparison. Then the losing style box is highlighted red, the winning is highlighted green for that trailing 3 year period. Mid-cap value and mid-cap blend are the only areas that never come in last for a 3 year period. And they each, especially mid-value, have a couple periods of outperformance. This data and more is available on the Bogleheads forum. The returns include dividends, and treasury bills and inflation are shown for reference.

There are a couple time periods that I highlighted. The first is the late 70s which saw crazy inflation levels. You’ll notice that mid-cap and small-cap stocks were able to keep pace with inflation and even surpass it; whereas large-cap stocks had trouble keeping up.
The second time period of interest in the late 90s, the tech boom; and then the bust in the early 2000s. Mid-cap value and small-cap value trailed large cap growth in the late 90s but still did well for themselves. But their outperformance comes shining through in the early 2000s when they were making money where most style boxes were losing. And mid-cap value had a crazy run in this time period of being the best style box up until 2007.
Lastly is the financial crisis in 2008. Small-cap value, mid-cap value, and large-cap value all lost money but they lost the least in 2008. Interestingly mid-cap value and small-cap value lost money in 2007; but come roaring back in 2009 and 2010.
Now let’s get a little crazy and see if we got lucky in the last 40 years. Below I’ve constructed a comparison of these asset classes going back to 1927, and the trailing 20 year annualized return is shown on the right for comparison. I highlighted the winner in dark green, second place in light green. Look how often mid-cap value and small-cap value either finishes first or second for the last 20 years; it’s insane! Now in that same light take a look at the worst (dark red) and second worst (pink). Growth stocks dominate the red! This isn’t some fluke with mid-cap value and small-cap value; they will continue their run!

Correlation Matrix
Here’s an interesting piece of information, the correlation between these asset classes over the last 40 years. First interesting thing is that inflation has a higher correlation to mid-cap, and an even higher correlation to small cap stocks. So if inflation is scaring you, go small. This also shows that if you aren’t willing to go fully into mid-cap and small-cap value, they offer nice diversity to a portfolio of large cap US equities. Their correlation is 0.77 and 0.66 to the S&P 500.

Summary Metrics of US Equity Style Boxes
Below is a table that summarizes the return characteristics of the different US equity style boxes. On the bottom two rows I compare the Sharpe and Sortino ratios with conditional formatting. Both mid-cap value and small-cap value clearly shine when looking at risk adjusted return. Another row shows the total return of a 1$ in real terms, after inflation. All metrics are based upon after inflation returns.

Has anyone else noticed this?
There seem to be a couple links out there that I list below. You’ll find though that these articles seem to be written more to the fund manager. They’re not geared to an audience of retail investors. Instead of ending the article with a recommendation to buy a passively managed fund that tracks this index, these authors tend to recommend “picking stocks” in this area. Seems like a fools game to me.
- John Hancock – Mid-Cap Stocks: Opportunities in the Heart of the Market
- Fidelity – Unique Performance Features of the Mid-Cap Value Equity Universe
- Fidelity – Comparing the results of value and growth stock market indexes
- Nuance Investments – Mid Cap Value Stocks: 20 Years of Outperformance
- TIAA CREF – Mid-cap stocks: the market’s sweet spot
- AQR – The Small-Firm Effect Is Real, and It’s Spectacular
- Wells Capital Management – Why Active Mid Cap Value Strategies may Outperform
Reading those articles you’ll realize that we here at Engineered Portfolio aren’t the only ones that have noticed this outperformance. But for some reason the average retail investor, and even many professional investors, don’t know about the attractive features of this area of the market.
In my opinion, the mid-cap value space is one of the best-kept secrets on Wall Street. Considering the features and benefits of the asset class discussed in this paper, both long- and short-term investors could potentially benefit from a well-considered allocation to this segment of the market.
How to Invest in Mid-Cap Value & Small-Cap Value
Again, I see the consistent returns mid-cap value and small-cap value and conclude that the only logical thing to do is to solely invest in this area (for my domestic equity exposure). There are a couple ETFs that I recommend for investing in that track these indexes:
- IJJ – iShares S&P 400 Mid-Cap Value
- IJS – iShares S&P 600 Small-Cap Value
- VOE – Vanguard Mid-Cap Value
- VBR – Vanguard Small-Cap Value
If you are still not convinced, take a look at a plot comparing mid-cap value, small-cap value, and the S&P 500 from 01/01/2001 to now.

What makes Mid-Cap Value work so well?
In the next post I take a look at why these indexes work so well. Is there something in the way that they’re structured that enables them, even forces them to consistently outperform? Spoiler alert, there is, and I’ll prove it.

Disclosures
The author(s) of this site have no formal financial investing training or certifications. The content on this site is provided as general information only and should not be taken as investment advice. All site content shall not be construed as a recommendation to buy or sell any security or financial instrument, or to participate in any particular trading or investment strategy. The ideas expressed on this site are solely the opinions of the author(s) and do not necessarily represent the opinions of sponsors or firms affiliated with the author(s). The author may or may not have a position in any company or advertiser referenced above. Any action that you take as a result of information, analysis, or advertisement on this site is ultimately your responsibility. Consult your investment adviser before making any investment decisions. This site/blog contains the current opinions of the author; the author’s opinions are subject to change without notice. This site is for informational purposes only and should not be considered as investment advice or a recommendation of any particular security, strategy or investment product. The charts and comments are only the author’s view of market activity and aren’t recommendations to buy or sell any security. Market sectors and related ETFs are selected based on his opinion as to their importance in providing the viewer a comprehensive summary of market conditions for the featured period. Chart annotations aren’t predictive of any future market action rather they only demonstrate the author’s opinion as to a range of possibilities going forward. All material presented herein is believed to be reliable but we cannot attest to its accuracy. The information contained herein (including historical prices or values) has been obtained from sources that Engineered Portfolio considers to be reliable; however, Engineered Portfolio makes no representation as to, or accepts any responsibility or liability for, the accuracy or completeness of the information contained herein or any decision made or action taken by you or any third party in reliance upon the data. Some results are derived using historical estimations from available data. Investment recommendations may change and readers are urged to check with tax advisors before making any investment decisions. Opinions expressed in these reports may change without prior notice. This memorandum is based on information available to the public. No representation is made that it is accurate or complete. This memorandum is not an offer to buy or sell or a solicitation of an offer to buy or sell the securities mentioned. The investments discussed on this site/blog may be unsuitable for investors depending on their specific investment objectives and financial position. Past performance is not necessarily a guide to future performance. The price or value of the investments to which this report relates, either directly or indirectly, may fall or rise against the interest of investors. All prices and yields contained in this report are subject to change without notice. This information is based on hypothetical assumptions and is intended for illustrative purposes only. PAST PERFORMANCE DOES NOT GUARANTEE FUTURE RESULTS.

Leave a comment