As often happens, Steve’s recent blog inspired me to think a little bit differently about my personal financial situation and my life. I don’t necessarily have a goal to retire early. I do however have a goal to be financially independent as soon as possible so that I can have full flexibility with how I spend the rest of my time on this planet. To me, this exercise is not about money, it’s about time.
In order to achieve financial independence you need to have enough in financial assets to fund your life. This amount of financial assets is what we call “The Number”. After digging into figuring out what my number was I realized it has multiple variables and assumptions involved that people may not think about. So it’s a little bit of work to figure out, but with the right approach, good data, logical assumptions and some guidance anyone can do it. To help you out I made a Google Sheet that captures all of this so you can figure out your own number in just a few minutes!

The Number
So what is the number and how do we calculate it? The number is the total amount of money we’ll need to be able to consistently tap our portfolio to fund our life. To calculate the number we need to know how much money we’ll need in the future, inflation during the entire period of time and our future tax rate. Yikes. But don’t worry, we’ll do most of the heavy lifting on the math and assumptions for you!
There are a few critical variables to determine a reasonably accurate number. I specifically use the word reasonably as all of these key factors have variability that you’ll want to do some sensitivity analysis on. Here are the primary variables:
- Retirement budget – how much do you need to fund your life
- Inflation and its impact on your purchasing power
- Rate of return on your investments
- Taxes – Types of accounts and where you live
- How much can you draw from your assets
In addition to these inputs there is the element of time. Not so much about when you are going to die (though that is important!) but when do you want to start drawing on your assets to fund your life. I’d say that is the key takeaway from this blog, the number is not static! The effects of inflation and time mean that our target number is constantly moving.
A couple of assumptions to be clear on before we move on. Our analysis of the number in this blog will assume we are building a system that could provide for you in perpetuity, so it does not matter when you die. To be clear we are not assuming any other forms of income other than your financial assets. So no social security, pensions, rental income, etc. We also assume there are not early withdrawal penalties from retirement accounts so if this analysis shows you retiring before age 59.5 you’ll have to consider that.
Retirement Budget
Budgets are not boring. Budgets are an exercise in establishing what you care about, your priorities in life. This is obviously unique to each individual. The goal here is to do a detailed budget that captures all of your needs and wants in life. As an example my wife and I want to travel more in retirement so we significantly increased that line item in our retirement budget compared to our budget today. The second tab of the Google Sheet has a budget template that you can make your own. When you update this budget tab it will flow through the rest of the sheet to calculate your number. For this exercise budget in today’s dollars, we’ll account for the impact of inflation…..which is critical!
Inflation
Inflation means the dollar you have today won’t buy as much stuff (goods and services) in the future. We have a certain amount of goods and services we want in retirement. If inflation is high while we are in our saving years, our number gets higher. A higher number takes more time to get to. Thus, we don’t like high inflation. Some may say, “well, how about deflation then!” Very good question. Yes this would make your number lower but it would most likely come along with other issues that would delay our ability to achieve the number as quickly as we would like. With inflation we want the Goldilocks scenario which is right around 2%.
So what number should we use to model inflation? The Philadelphia Federal Reserve performs something called the Livingston Survey where they ask a bunch of professional financial forecasters what they think inflation will be in the next 10 years. As of the writing of this blog it is 2.26%. They continually update this forecast. This is as good of an assumption as any. That being said these people are not wizards, they could be wrong. In fact they will most likely be wrong, the question is just by how much and in which direction. Based on this, when you are playing around with the Google Sheet be sure to change inflation to see how it impacts your number and timeline.
Rate of Return On Your Investments
This is a sticky one. Your rate of return will largely be driven by four factors: (1) When you are investing, (2) your asset allocation, (3) how much you pay in fees (4) your ability to avoid behavioral finance pitfalls (i.e., can you stick with your plan and not panic sell or euphoric buy).
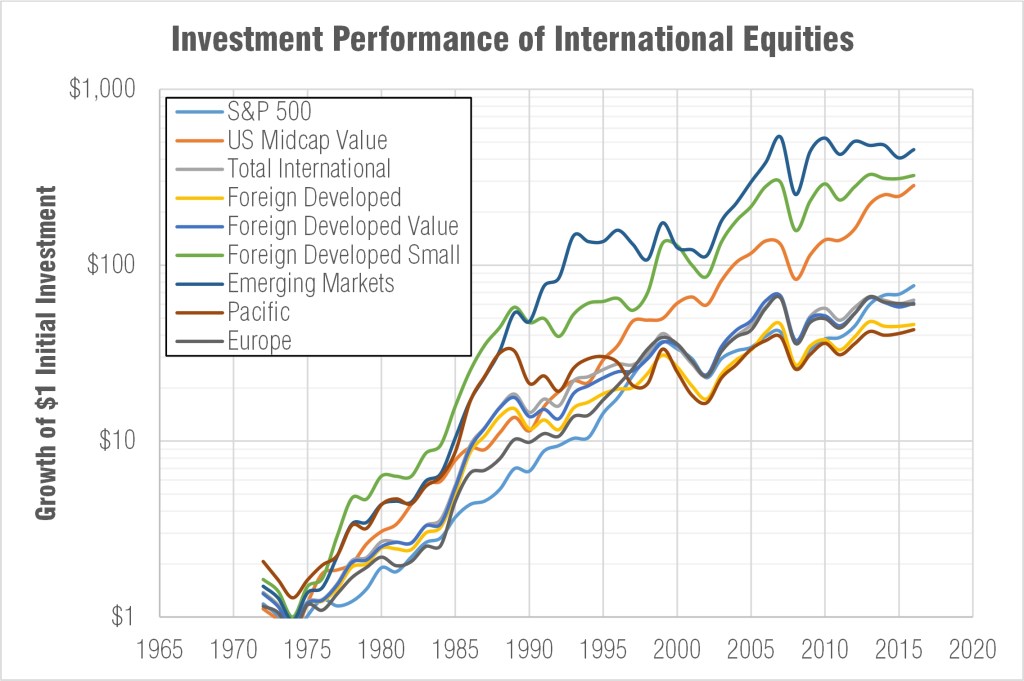
As far as when you are investing there is an element of luck here. Some generations get tailwinds and some get head winds. However, over a long enough period of time generally things should smooth out. Let’s assume a 30 year investing window looking only at the S&P500. If you invested from 1980 to 2010 your annualized return (with reinvested dividends) was 11.08%. From 1990 to 2020 it was 10.09%. So not a huge difference and both are healthy rates of return. That being said, the impact of increasing your rate of return by even 1% can have a significant impact on how quickly you can achieve hitting your number. I pulled this return data from the Of Dollars and Data website, it is a pretty fun tool that also shows the inflation adjusted returns.
So you can’t control when you are investing as it’s just a function of when you were born. The remaining factors that impact your investment rate of return are in your control. We’ll start with asset allocation. I won’t belabor this as we have many blogs on this. Our homepage shows the portfolios Steve has built that do a nice job of balancing risk and return. All this is to say you need to have an asset allocation plan and stick with it. That plan can change over time as you age, that is fine. But have a plan. Your choice in asset allocation will be a major factor in your rate of return.
You also can control what you pay in fees. Again, I won’t belabor this as we have a good blog on the corrosive nature of fees. All things being equal, keep fees low and it will improve your rate of return.
The last major impact on your investment return rate is your cave man brain. If you can manage it well you will protect and possibly improve your returns, if you do not you can kill your returns. Check out our blog on the behavioral elements of investing for more details.
So now, what the hell should we assume for our rate of return. For myself and my asset allocation I use 8% (7.7% actually but I’m rounding up for simplicity). This is a blend of historical data like was shared above with some conservative assumptions. Like all the other key variables that impact our number we’ll run some sensitivity analysis on this.
Taxes – Types of Accounts and Location
As it relates to the number, we need to figure out what your tax rate will be in retirement. This is impossible as we do not know what tax policy will be in the future. In addition to this, there is complexity that will impact your ultimate tax rate such as the types of accounts, your tax bracket, where you live, how much is coming from dividends, how much is long term capital gains and how much is ordinary income. This is one of the reasons why I love Roth accounts. It future-proofs your tax situation as distributions are not taxed. My advice would be to get as much money into Roth accounts as you can. I understand it may not ALWAYS be the best financial move based on rates today versus tomorrow, but that is the point, no one knows what they will be tomorrow! To be clear the estimated tax rate in the Google sheet is just an estimate and should not be used for any real tax planning. Here are some of the different types of income and their associated rates.
- Federal Ordinary Income 12% to 24% for most people
- State Ordinary Income – Varies by State
- Long Term Capital Gains 0% to 20% depending on filing status and income level
- Dividends 0% to 20% depending on filing status and income level
Withdrawal Rate – How much can you tap your number?
A major factor in determining our number is to know how much we can safely draw from our number to fund our life. Many people use the 4% rule which was developed by William Bengen. This means that each year you can safely take 4% of your assets to fund your life and you should never run out of money. So if you had $1M in assets you could take $40,000 in the first year and then increase your withdrawal due to inflation each year. Mr. Bengen recently updated his popular 4% rule to the 4.7% rule, which is great as it means our number can be lower and thus we can retire sooner!
I trust Mr. Bengen, but let’s do a back of the envelope calculation here. As I shared earlier, with my asset allocation I think I can earn 8%. I estimate inflation to be 2.26%. So I assume a $1M portfolio generates an $80,000 (8%) return of which I draw $47,000 (4.7%) I’m left with $33,000 (3.3%) added to my principal. However, inflation eroded my purchasing power to the tune of $22,600 (2.26%). Even considering inflation, with the 4.7% rule I was able to add to my principal balance but more importantly I (very slightly) added to my purchasing power. Based on this rough analysis I’d say the 4.7% rule seems reasonable. I fully realize I did not consider exactly when during the year I was taking the money and the impact that would have on my 8% return. The purpose with this back of the envelope analysis was to kick the tires on the 4.7% rule and it seems reasonable.
Example of Calculating Your Number
We now have everything we need to calculate your number. Using the Google Sheet we made for this blog it should only take a couple of minutes to calculate as long as you have your data ready. The Google Sheet is read only so you’ll first need to copy the sheet for yourself by going to File:Make a Copy. Enter your budget on the “Retirement_Budget” tab and enter data specifically for you in every green cell on the “”Inputs_Outputs” tab. Then voila, you have your number and you can play around with your inputs to see how it will impact when you can retire. We’ll walk through an example to show how to use the Google Sheet.
For our example we’ll assume we are calculating the number for the Johnsons, a 50-year-old couple with two teenage kids who live in Massachusetts that want to spend their retirement visiting family around the country and seeing every national park in the US. They have two homes which will both be paid off before retirement.
The Johnsons budget is shown below. For your budget think about what are the major factors for you. Will you still have a mortgage? Will you want to travel more? Will you go out to dinner more? What will you do less? As an example I currently have two growing boys that are huge, they eat a lot. So my grocery budget will be less than it is now in retirement…I hope. Think about these things and put together a good detailed budget based on what you need and want in life.
| BUDGET ITEM | AMOUNT (Today’s Dollars) |
| Mortgage/Property Taxes/Rent | $15,000 |
| Travel/Vacation | $12,000 |
| Groceries | $8,000 |
| Restaurants | $3,000 |
| Entertainment | $4,000 |
| Utilities | $2,000 |
| Gifts | $2,000 |
| Clothing/Shoes | $2,000 |
| Home Cleaning | $0 |
| Charitable Giving | $2,000 |
| Healthcare/Medical | $15,000 |
| Gasoline/Fuel | $1,200 |
| Telephone | $1,200 |
| Home Improvement | $3,000 |
| Insurance | $3,000 |
| Personal Care | $1,200 |
| Cable/Satellite | $1,200 |
| Automotive | $6,000 |
| Home Furnishings | $2,000 |
| Home Gardening/Landscaping | $1,200 |
| Dues & Subscriptions | $1,200 |
| Taxes (Not Income Taxes) | $2,000 |
| Electronics | $2,400 |
| Pets/Pet Care | $600 |
| Home Maintenance | $2,400 |
| Hobbies | $3,000 |
| Service Charges/Fees | $600 |
| <input other expenses> | $0 |
| <input other expenses> | $0 |
| <input other expenses> | $0 |
| <input other expenses> | $0 |
| RETIREMENT BUDGET | $97,200 |
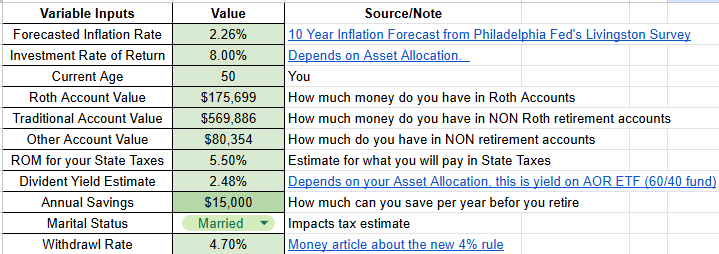
The Johnsons have done a pretty good job, they have $825,939 in financial assets across all of their accounts. Here are all the inputs for the Johnsons:
- Forecasted Inflation Rate
- 2.26% per Philly Fed estimate – I would leave this alone but then we’ll play around with it to see how inflation impacts our number….really how it impacts time
- Investment Rate of Return
- 8.00% – See earlier comments, another one we can play around with
- Current Age – The Johnsons are both 50 years old.
- Roth Account Value
- Add up all of your Roth accounts and enter into this cell, Roth IRA’s , 401k’s etc.
- The Johnsons have $175,699 in Roth accounts
- Traditional Account Value
- Add up all of your traditional retirement accounts, Traditional IRA’s, 401k’s, 403B’s etc.
- The Johnsons each have a traditional 401k with a total of $569,886
- Other Account Value
- Add up all of your financial assets outside of retirement accounts, so brokerage accounts, savings accounts, etc.
- The Johnsons have a handful of brokerage accounts totaling $80,354
- ROM for your State Taxes
- Depending on where you live enter your State tax rate…..in addition to the nice weather in the winter, this is why people move to Florida in retirement
- The Johnsons live in Massachusetts and plan to stay there in retirement. Massachusetts has a 5.5% income tax.
- Dividend Yield Estimated
- This is a little tough as it greatly depends on your asset allocation, our estimate is the current yield on AOR which is an ETF that holds 60% equities and 40% bonds. This is considered a relatively safe investment that people might hold during retirement. To be clear I’m not recommending this, in fact some people think the 60/40 is too conservative, even for retirement!
- The Johnsons are assuming a 2.48% dividend yield
- Annual Savings
- This is how much you can save per year from now till you retire, again you can play around with this and see how it impacts your number and time horizon
- The Johnsons save $15,000 into their 401k’s each year. They try to save outside of their retirement accounts but with kids and college costs they really can’t.
- Marital Status
- Obviously only you know this one, this only impacts the rough order of magnitude tax rate estimate
- The Johnsons are married
- Withdrawal Rate
- 4.7% per William Bengen’s famous rule of thumb
- The Johnsons assume William Bengen knows what he’s talking about
Here are the Johnsons inputs:
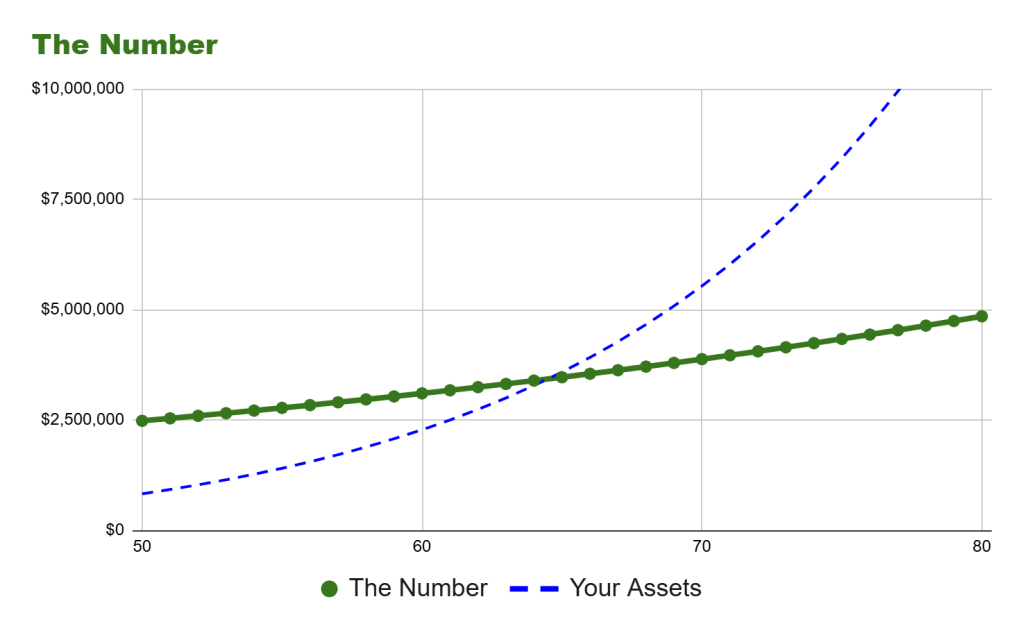
Now that all of the data is in for the Johnsons we can look at the results and play around with some of the assumptions to see how it would impact the number and timeline for the Johnsons to retire. A few key things. In cell D20 (highlighted in yellow) is their number today. This means if they had $2,479,442 in financial assets they could retire today. However, they do not. They have $825,939, so a good amount but not nearly enough to live off of their assets. With all of the other assumptions they could retire at age 67. This is the first time their assets (blue dashed line) exceeded their number (green solid line with green dots).
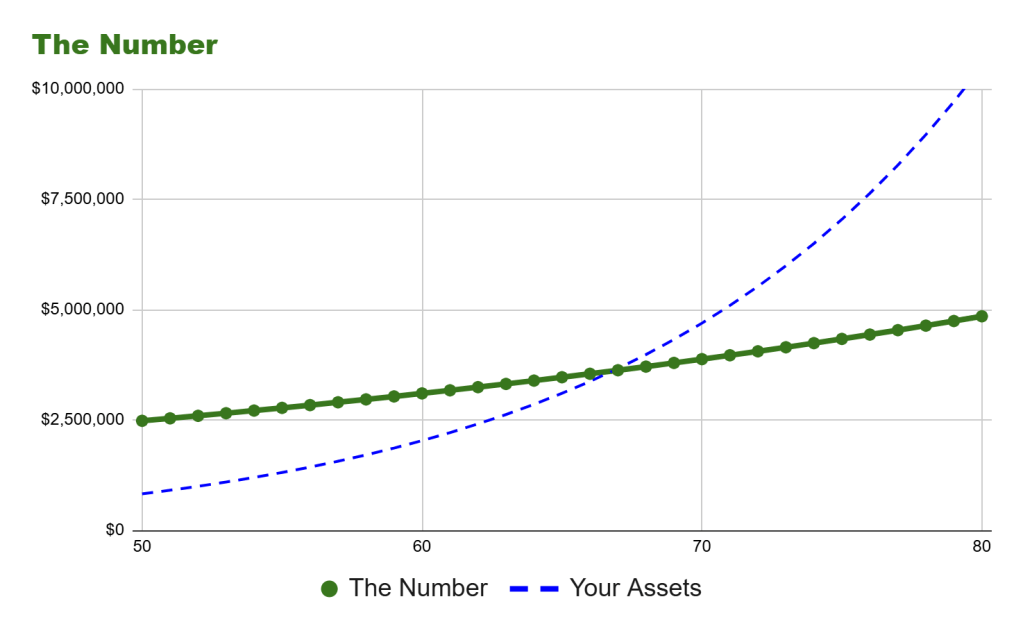
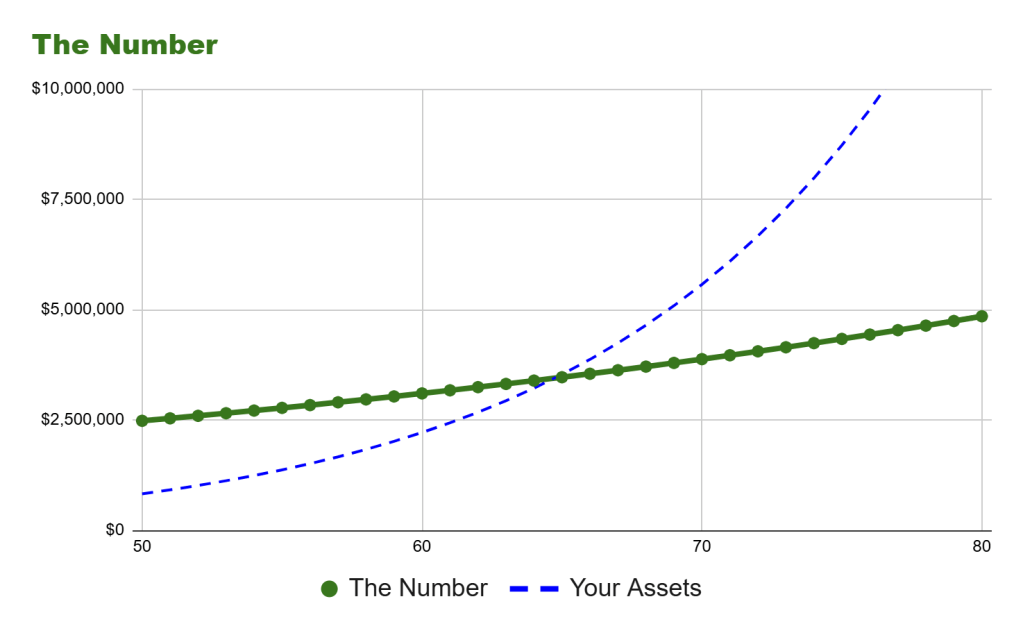
Note that their number (green line) get’s higher over time, this is due to inflation. As mentioned earlier inflation has a major impact on when we can retire all else being equal. So let’s increase inflation by 1% to 3.26%. How much will that impact the Johnsons?
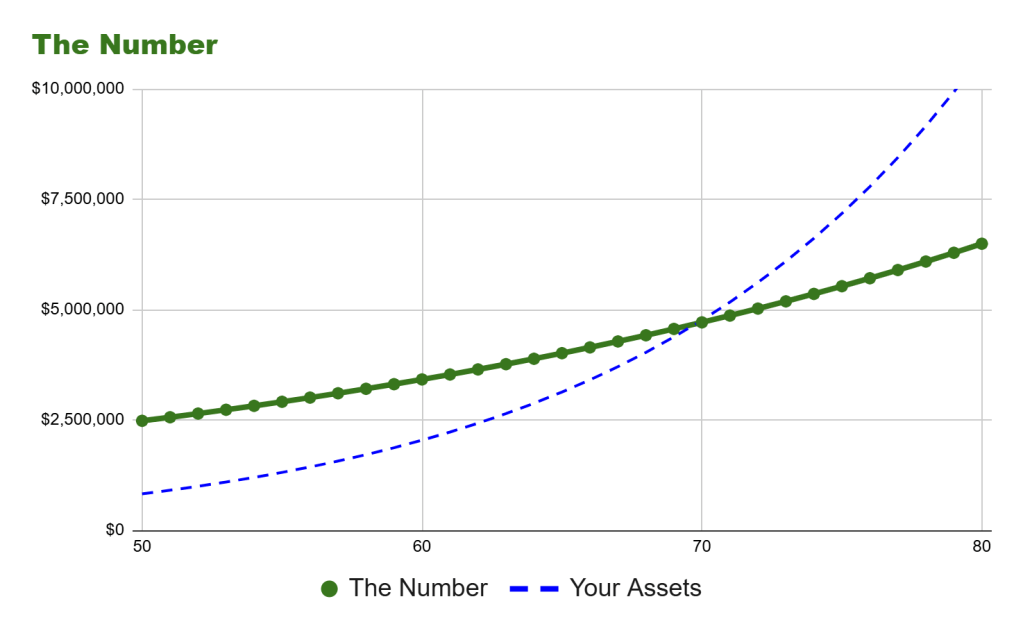
Increasing inflation by 1% would delay the Johnsons retirement by 3 years! They now will have to wait until age 70 to retire.
Let’s be a little more optimistic. Let’s put inflation back to 2.26% and assume the Johnsons can save $30,000 a year instead $15,000. How does this impact their number and timeline?
Doubling their contribution amount would allow them to retire between 64 and 65, saving them a little over 2 years compared to our base case. Not too bad. Now let’s put that number back to $15,000. So now we are back to 2.26% inflation and saving $15,000 per year. Let’s increase the rate of return by 1% from 8% to 9%.
This basically has the same effect on time as doubling the annual contribution where the Johnsons can retire between 64 and 65.
Conclusion
Calculating ‘The Number’ can feel daunting, but as we’ve seen, it’s really just a bunch of solvable variables. The real value isn’t in finding a magic digit that solves all your problems; it’s in the clarity that the knowledge provides. We often avoid looking at our finances because we’re afraid of what we might find, but ignorance isn’t bliss—it’s just a lack of options.
Whether your number is $2 million or $10 million, knowing it is the only way to effectively close the gap between where you are and where you want to be. This isn’t just about retiring; it’s about buying back your freedom, one calculated assumption at a time. So, go make a copy of the sheet and play with the inputs. You might be closer than you think.